
NCERT Diagrams
NEET frequently tests 20 key NCERT diagrams including the Krebs Cycle, DNA Replication Fork, Nephron structure, Cardiac Cycle, and Z-scheme of photosynthesis. Mastering these diagrams from Class 11 and 12 Biology, Physics, and Chemistry can directly earn 30-40 marks in the exam.
Audio Note · Biology: NCERT Diagrams
Top 20 NCERT Diagrams – Audio Guide
0:000:00
NEET doesn't just test what you know — it tests what you can visualise and label accurately. Every year, 15-20 MCQs are directly or indirectly based on NCERT diagrams. This expert-curated listicle ranks the 20 most frequently asked diagrams from Class 11 and 12 NCERT, covering Biology, Chemistry, and Physics. Master these, and you secure easy marks that most aspirants lose to careless labelling errors.
Pair these diagrams with the NCERT Biology Class 11 notes and free revision PDF. For the Calvin cycle and electron flow, use our Photosynthesis notes with the Z-scheme and C3 vs C4 table.
1
Krebs Cycle (TCA Cycle)
Biology
Respiration in Plants · Class 11, Ch. 14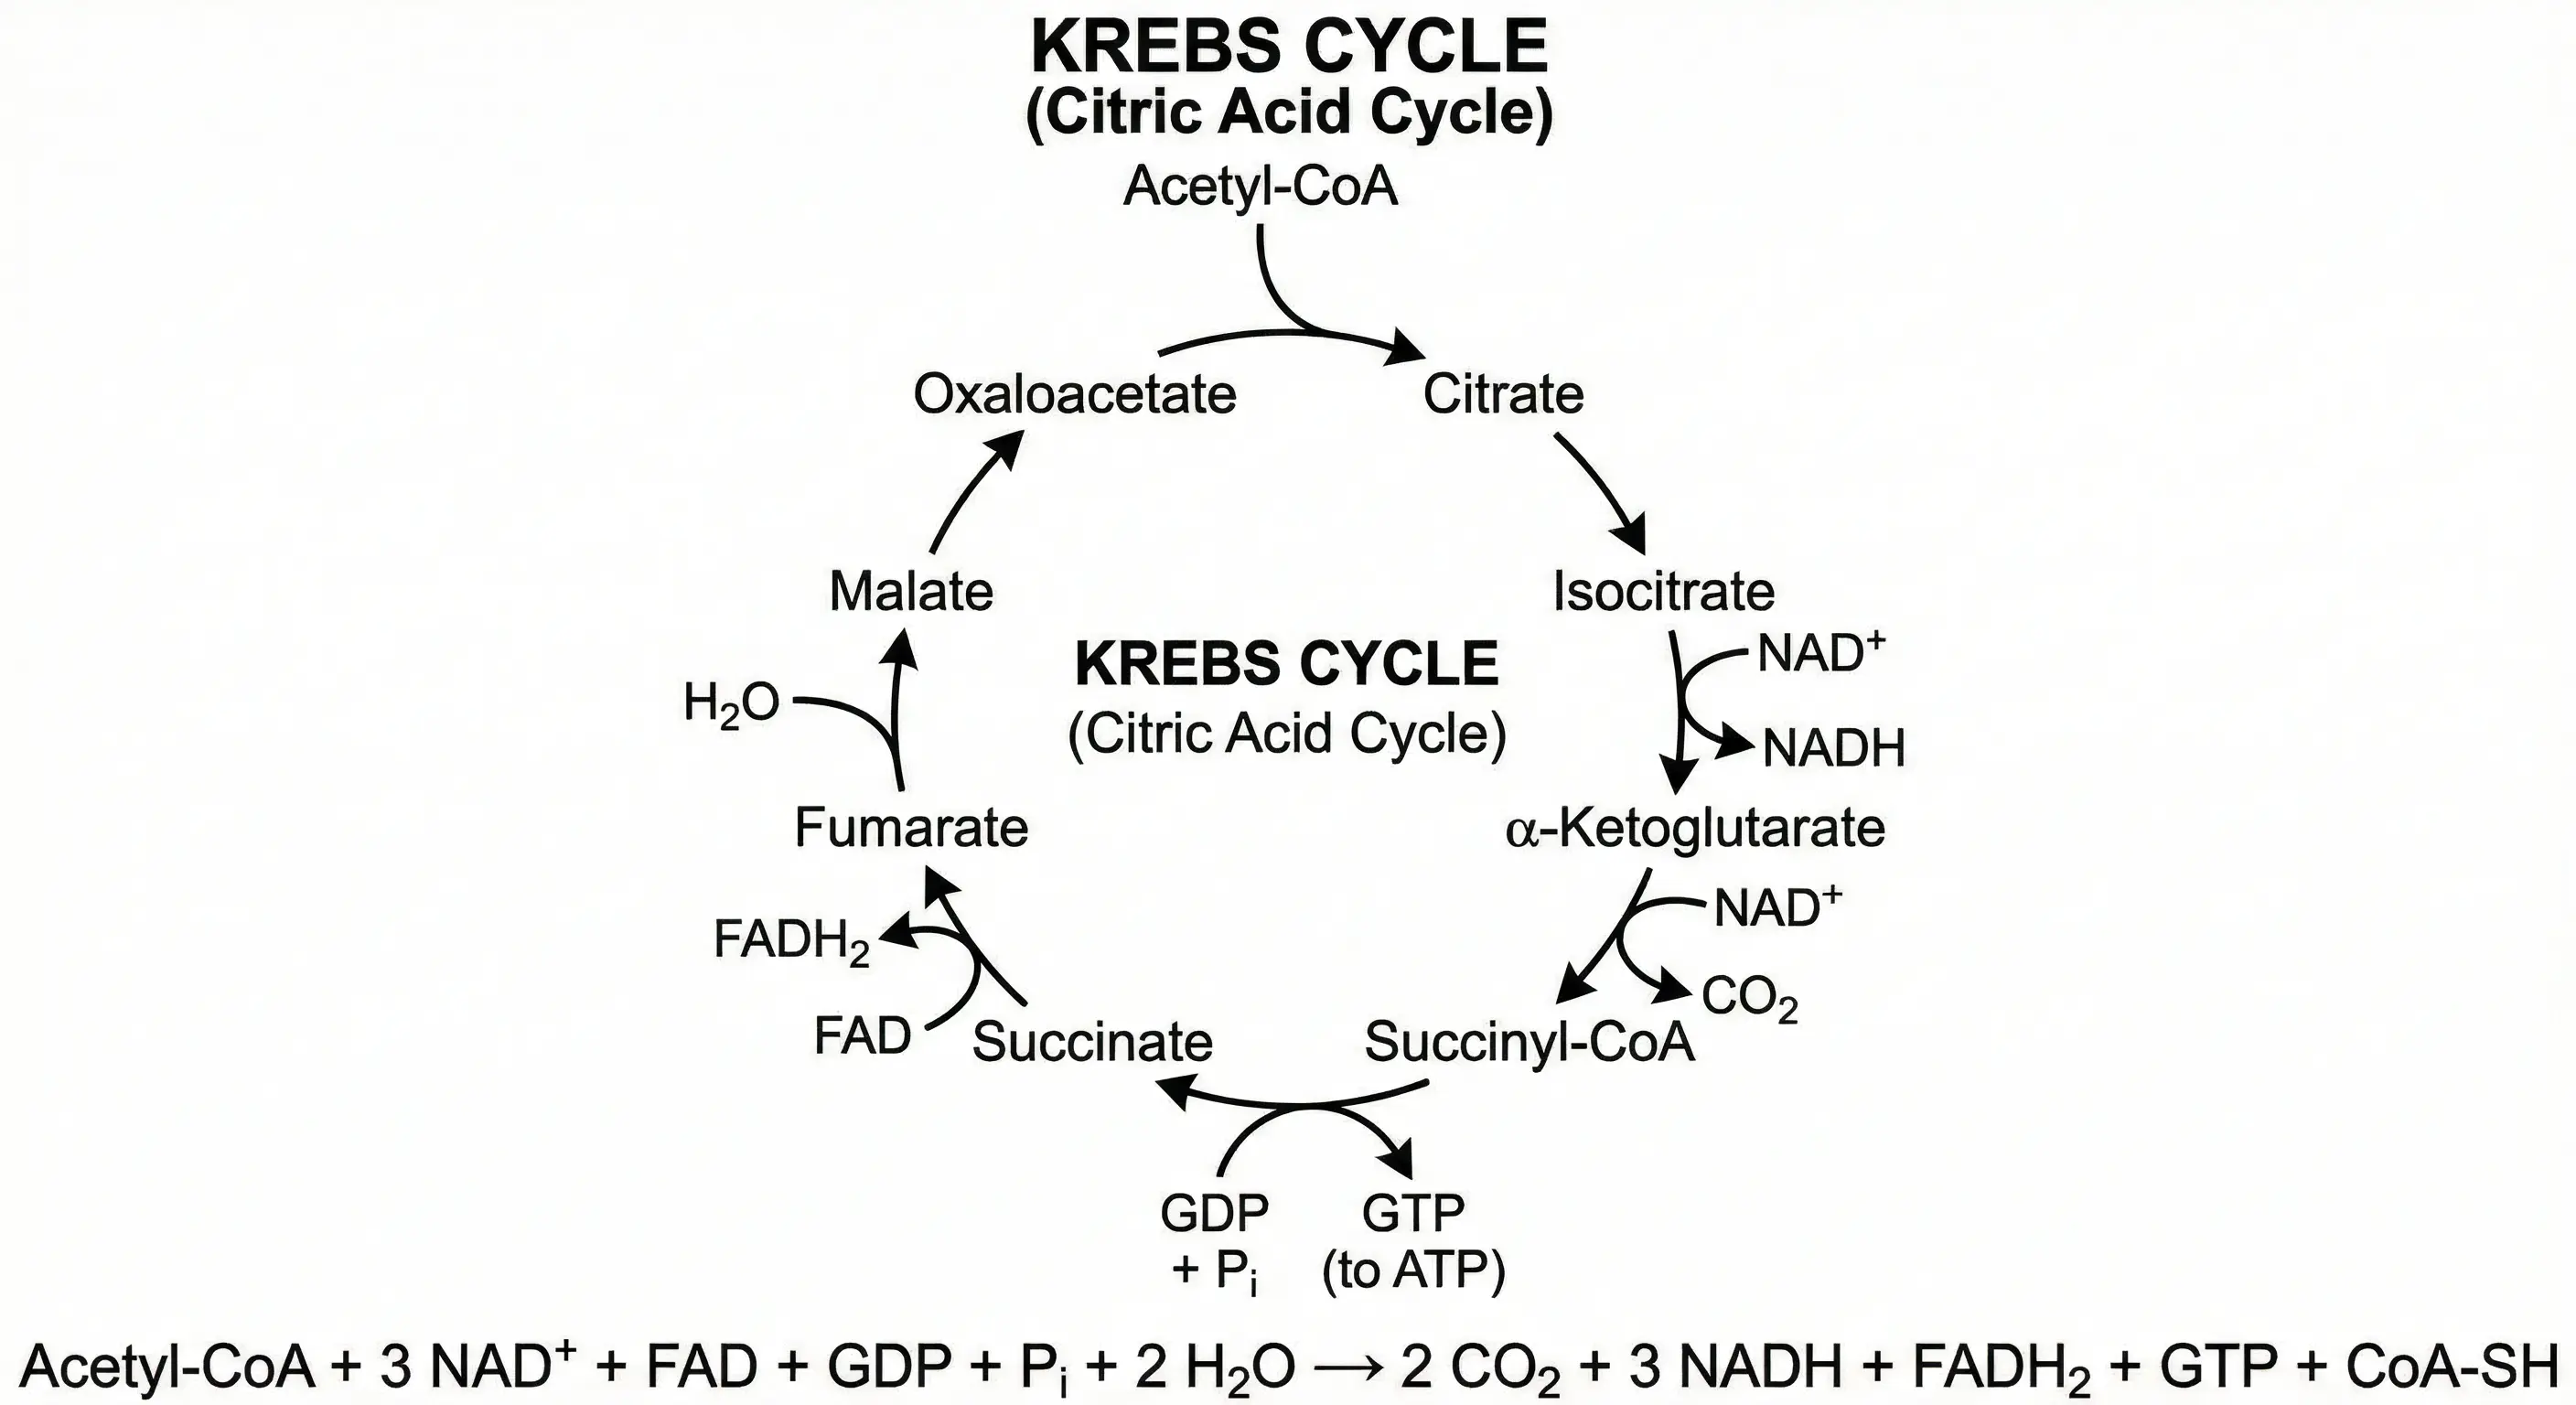
Why it's high-yield: Tests enzyme sequence, substrate-level phosphorylation, and CO₂ release points. Expect 2-3 direct questions every year.
Continue with Respiration in Plants notes · Respiration in Plants MCQs · Respiration in Plants audio revision.
2
DNA Replication Fork
Biology
Molecular Basis of Inheritance · Class 12, Ch. 6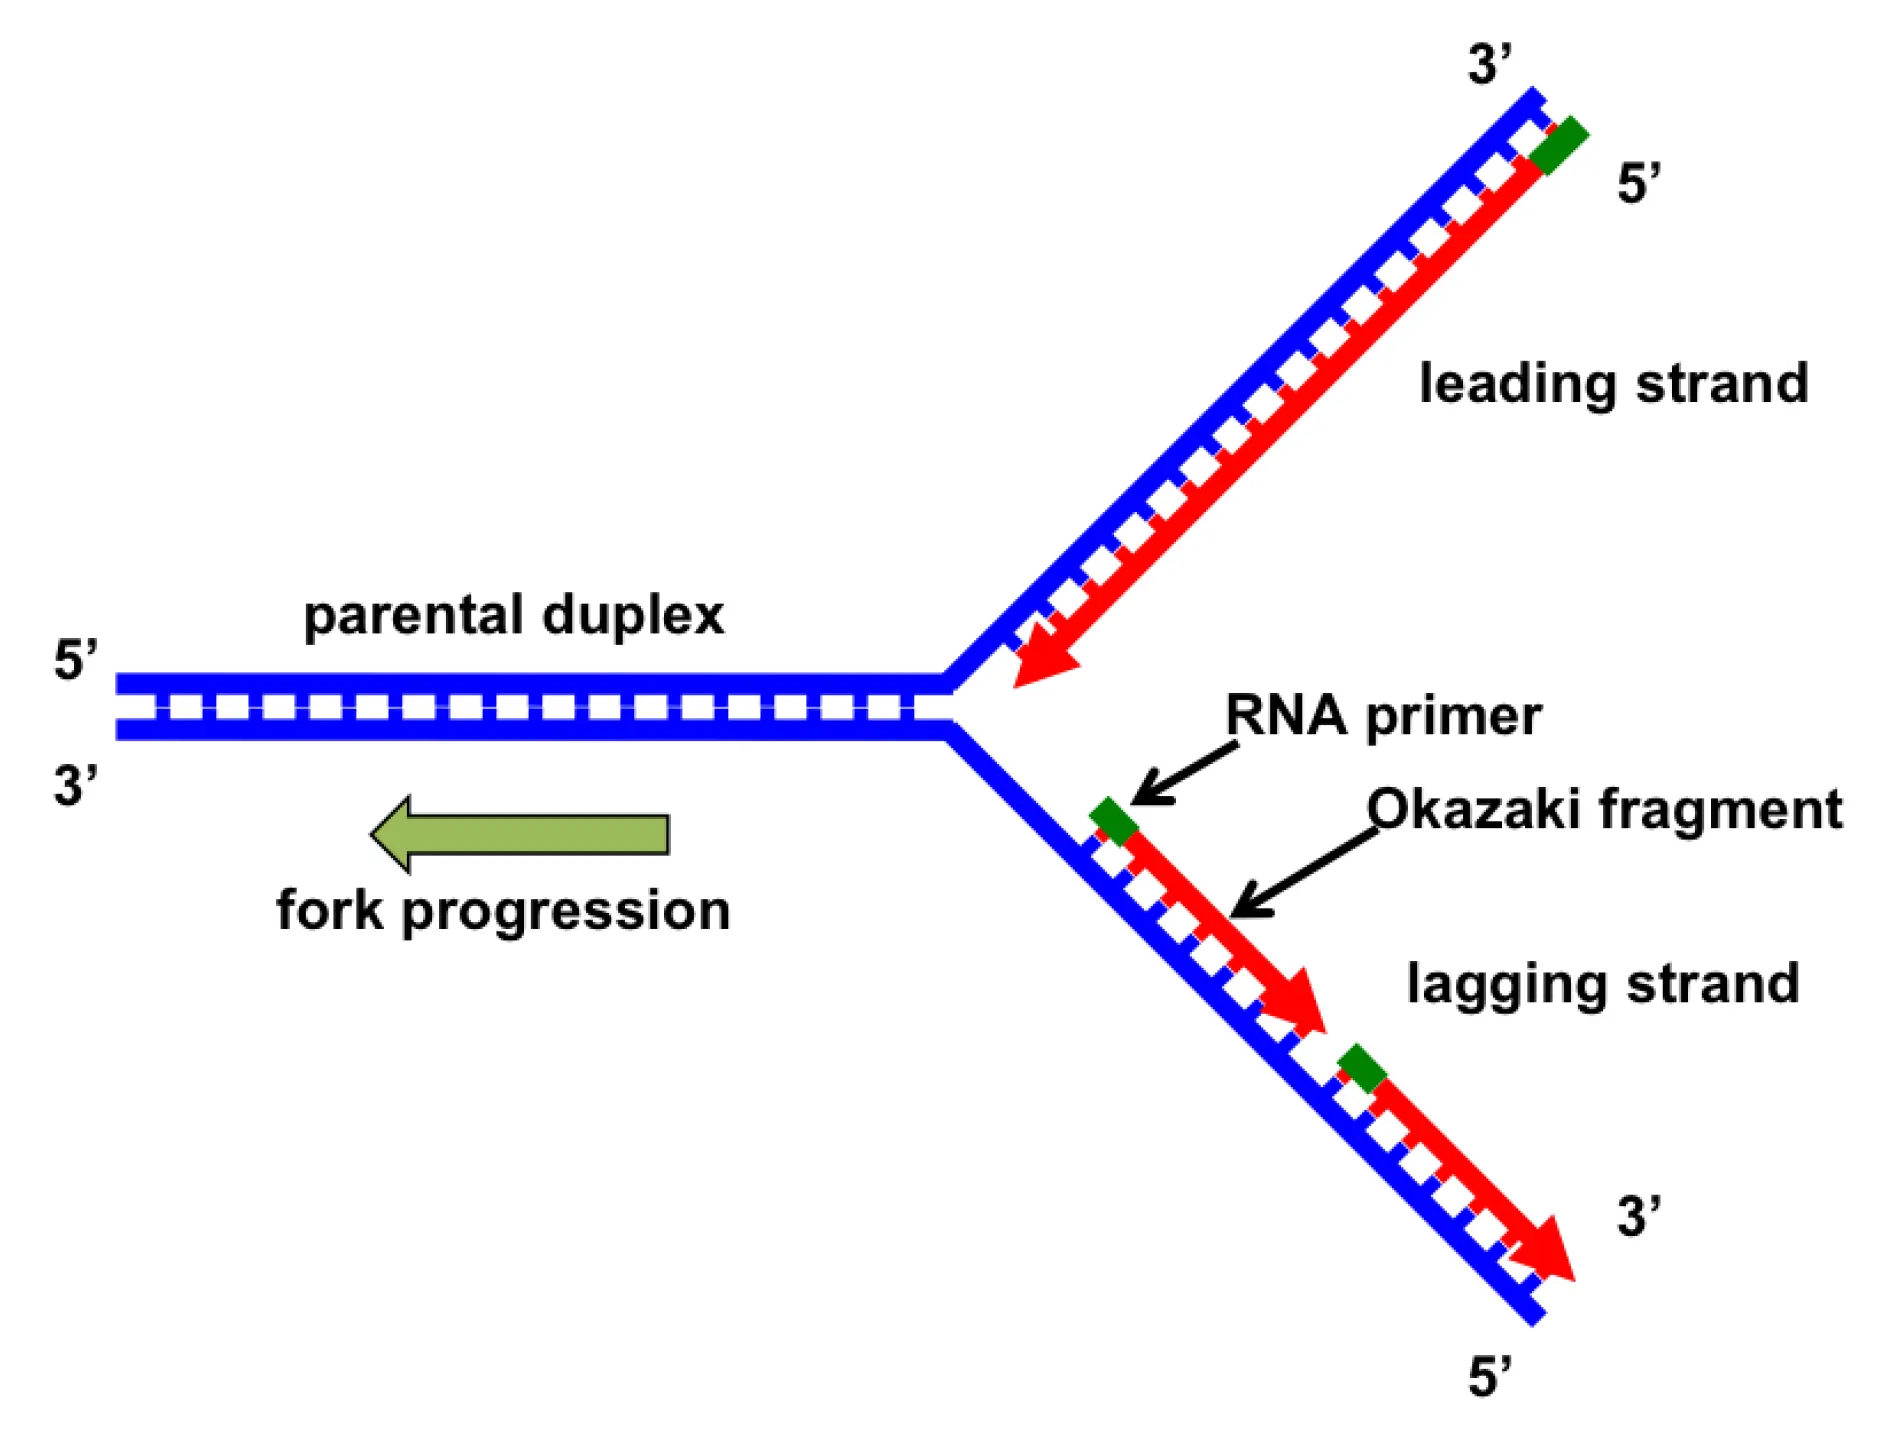
Why it's high-yield: Leading vs lagging strand, Okazaki fragments, and helicase/primase roles are perennial NEET favourites.
Continue with Molecular Basis of Inheritance notes · Molecular Basis of Inheritance MCQs · Molecular Basis of Inheritance audio revision.
3
Nephron Structure & Countercurrent
Biology
Excretory Products · Class 11, Ch. 19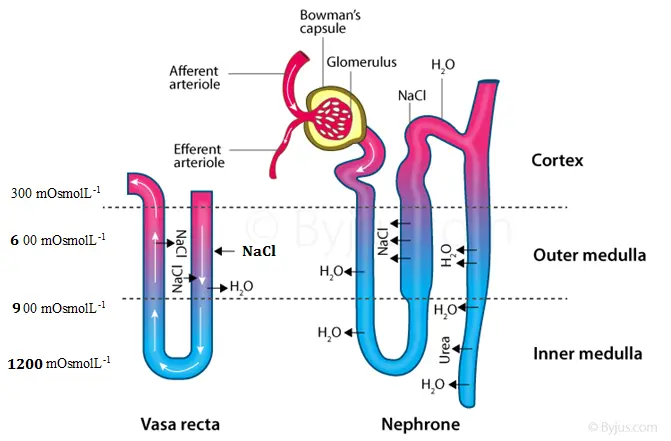
Why it's high-yield: Labels of PCT, DCT, Loop of Henle, and the countercurrent multiplier mechanism are tested almost every year.
Continue with Excretory Products notes · Excretory Products MCQs · Excretory Products audio revision.
4
Calvin Cycle (C3 Pathway)
Biology
Photosynthesis in Higher Plants · Class 11, Ch. 13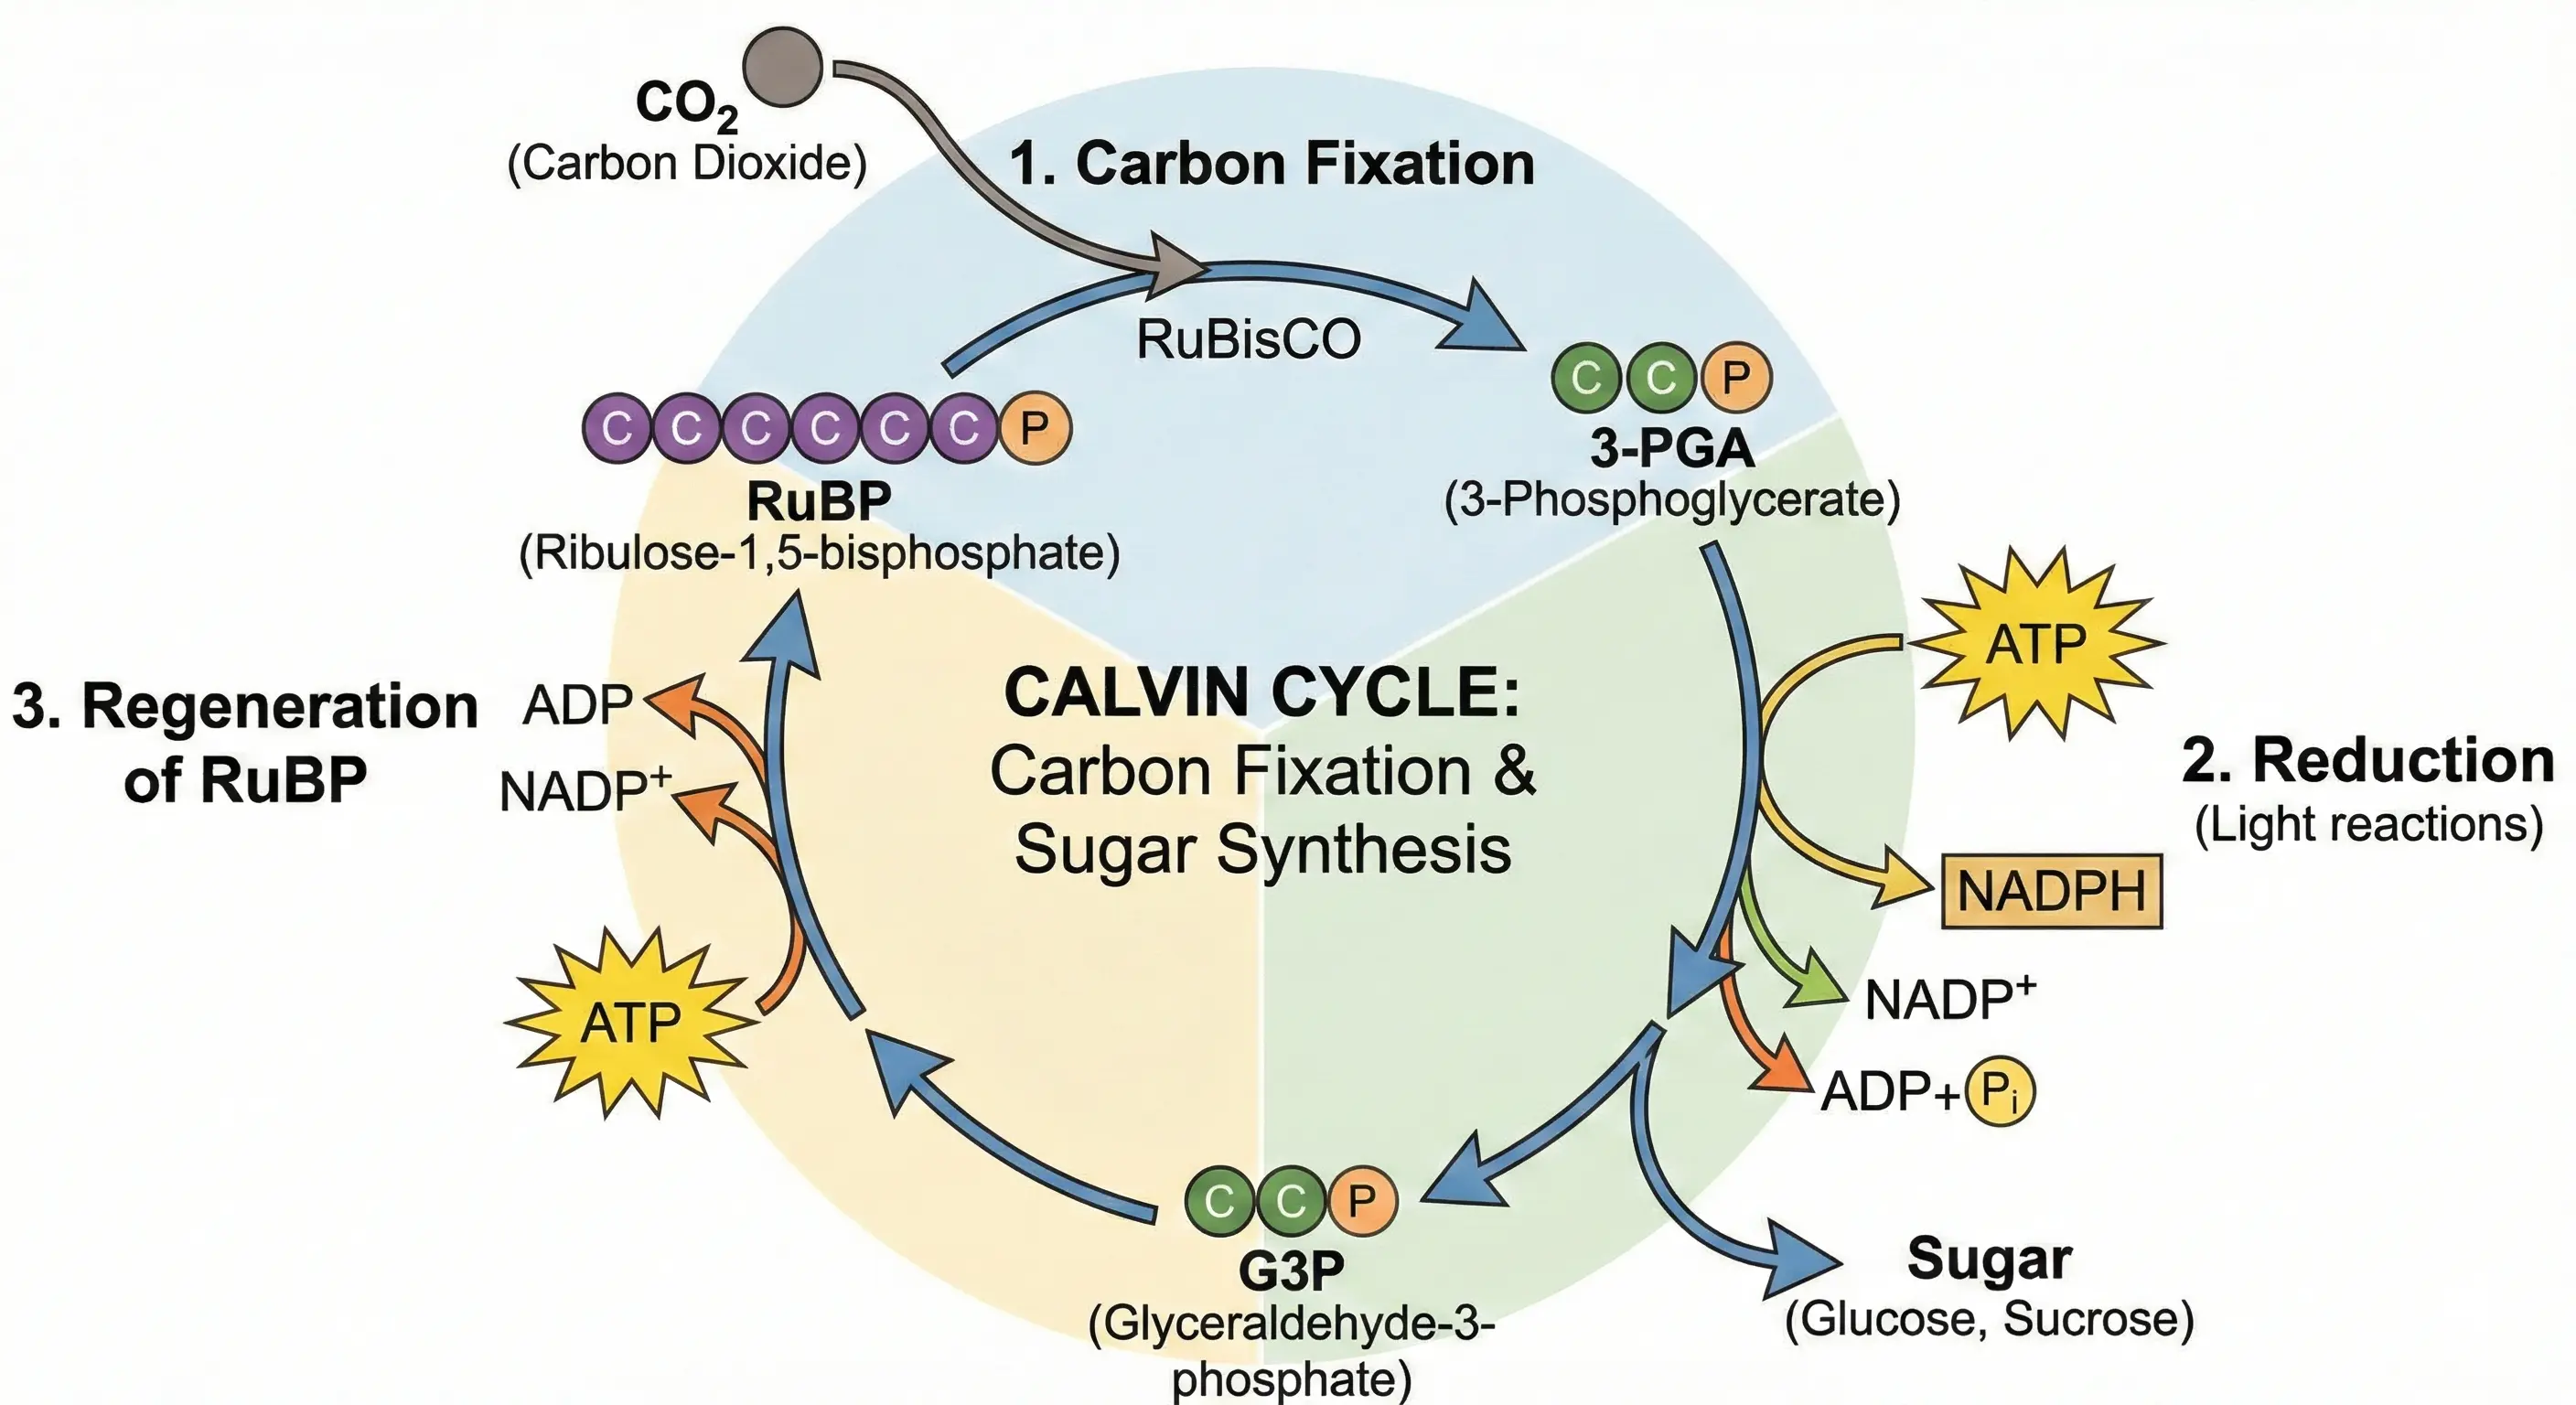
Why it's high-yield: Carbon fixation by RuBisCO, 3-PGA reduction, and RuBP regeneration — tested as MCQs on ATP/NADPH consumption.
Continue with Photosynthesis in Higher Plants notes · Photosynthesis in Higher Plants MCQs · Photosynthesis in Higher Plants audio revision.
5
Sarcomere & Sliding Filament Model
Biology
Locomotion and Movement · Class 11, Ch. 20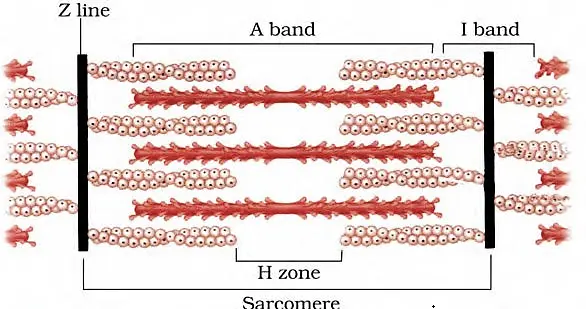
Why it's high-yield: A-band, I-band, H-zone, and Z-line identification plus cross-bridge cycling appear in diagram-based MCQs.
Continue with Locomotion and Movement notes · Locomotion and Movement MCQs · Locomotion and Movement audio revision.
6
Synapse Structure
Biology
Neural Control · Class 11, Ch. 21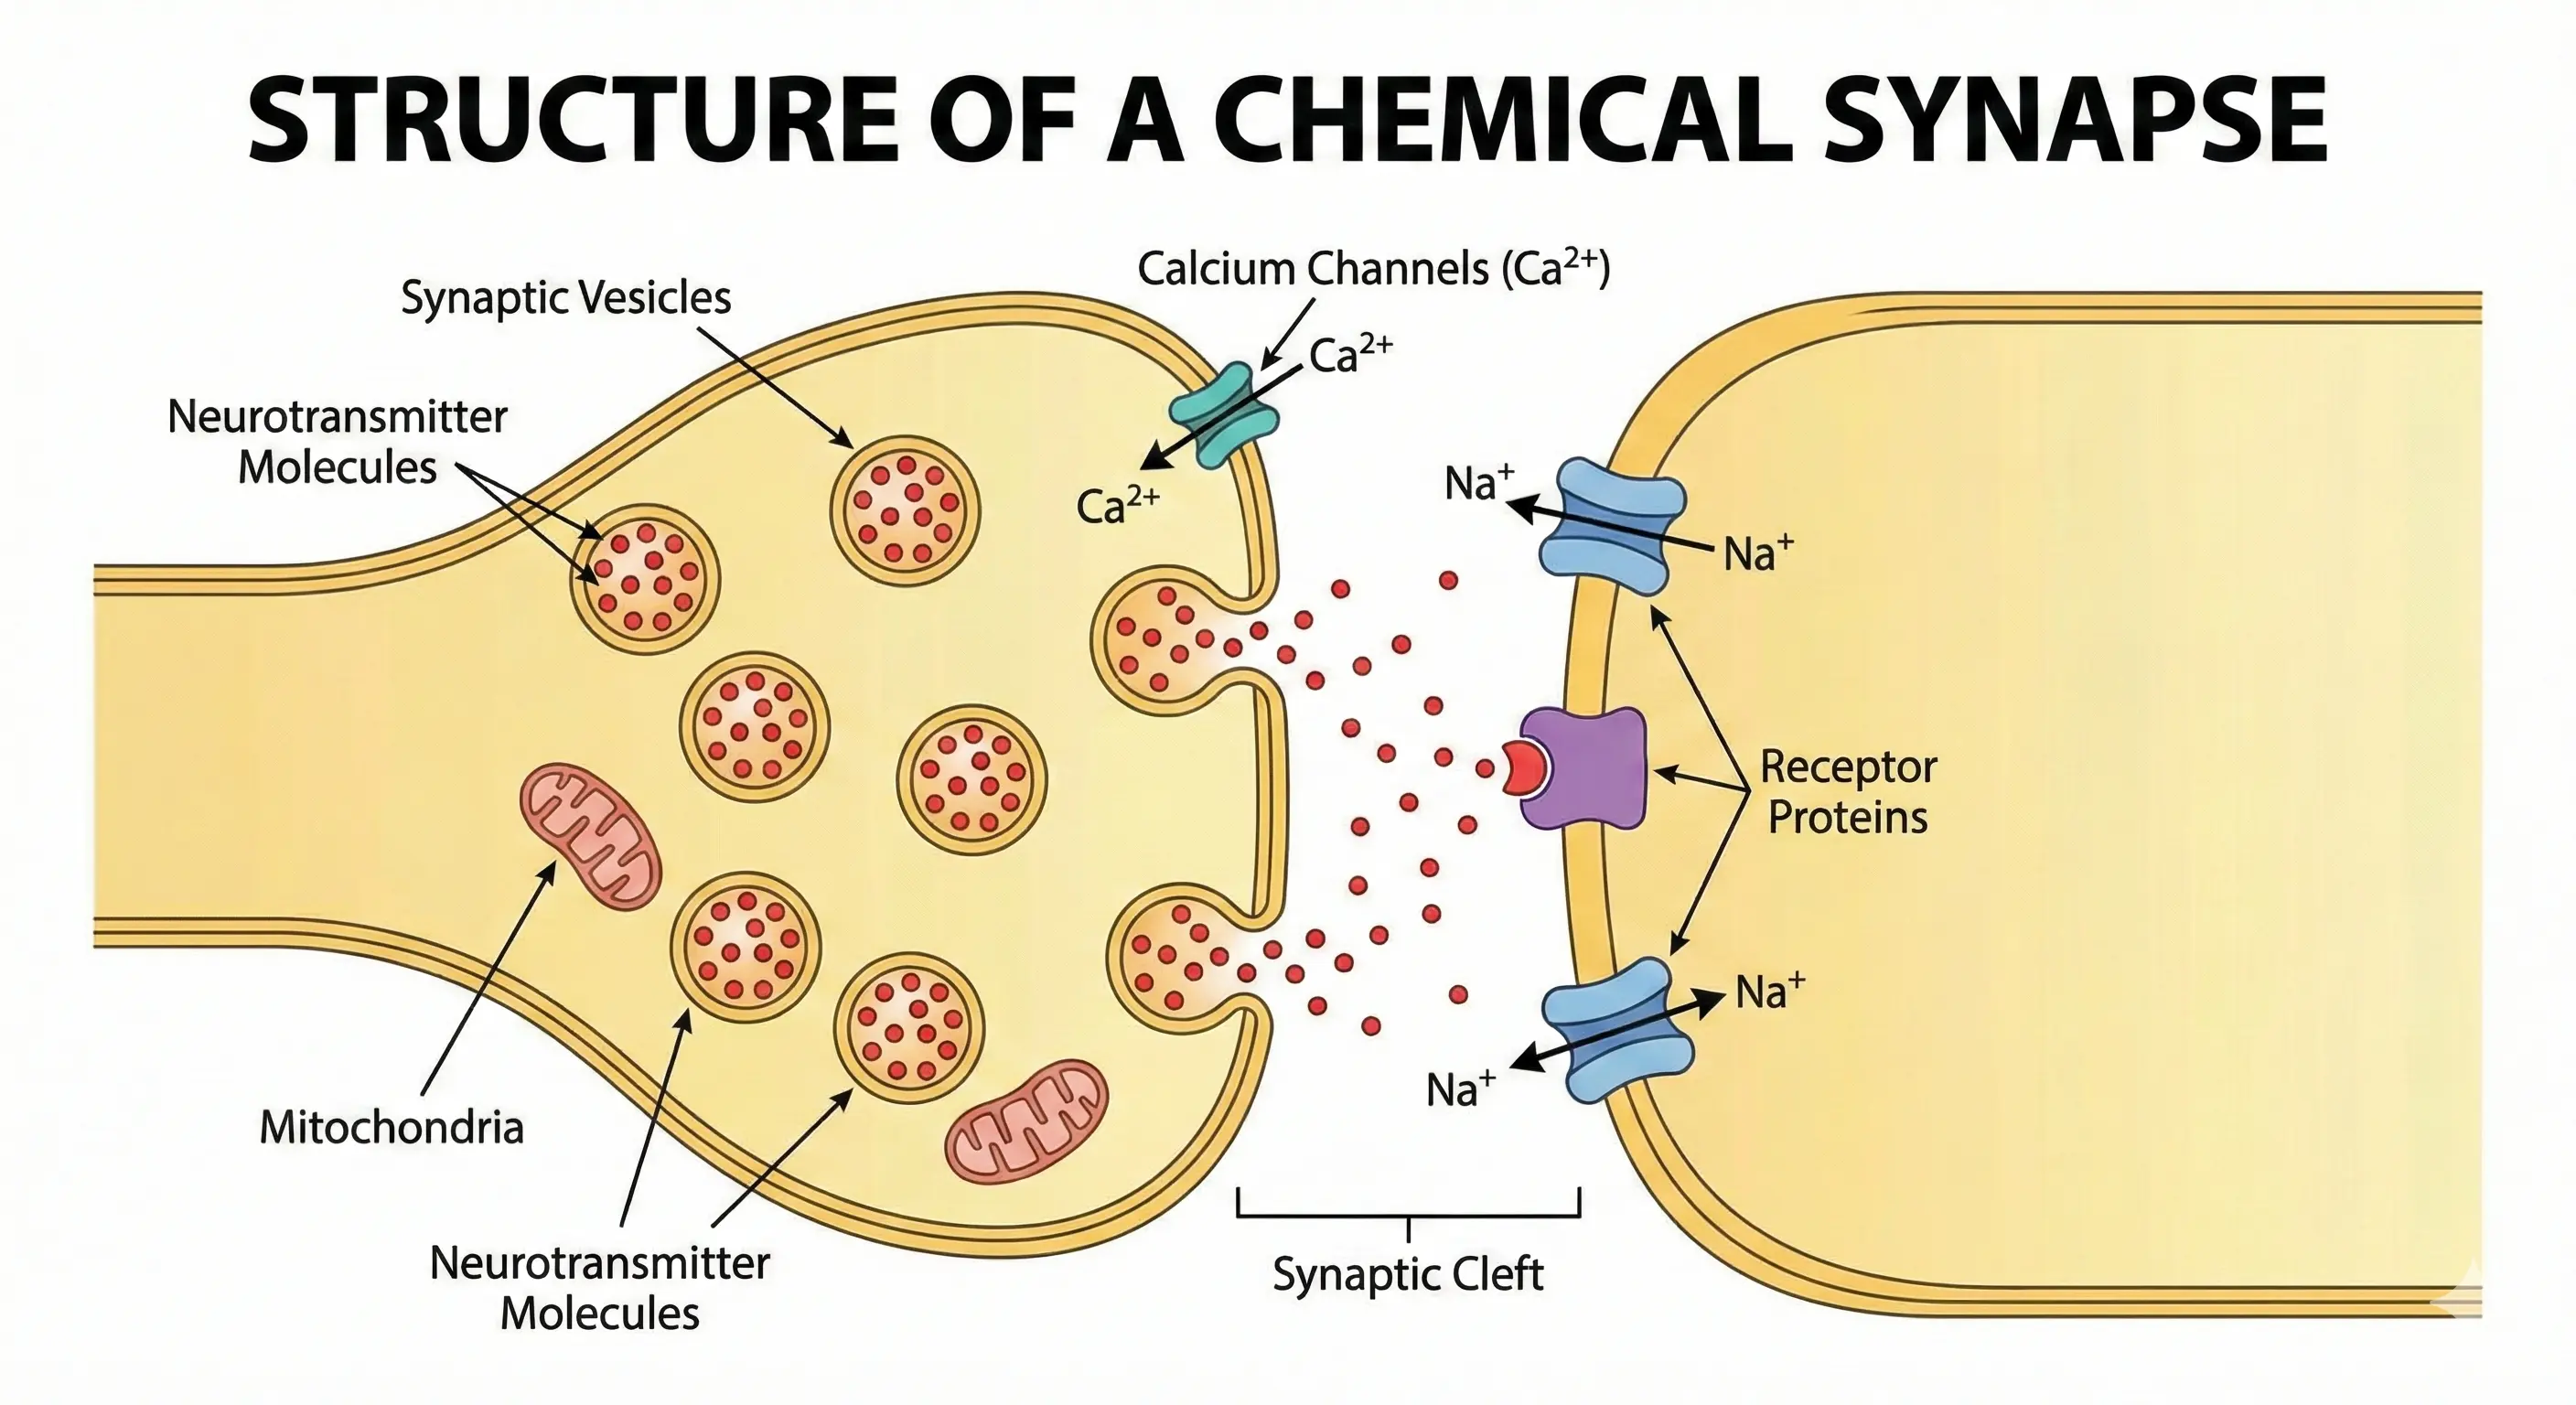
Why it's high-yield: Synaptic cleft, vesicles, neurotransmitter release, and receptor binding — frequently tested in physiology MCQs.
7
Action Potential Graph
Biology
Neural Control · Class 11, Ch. 21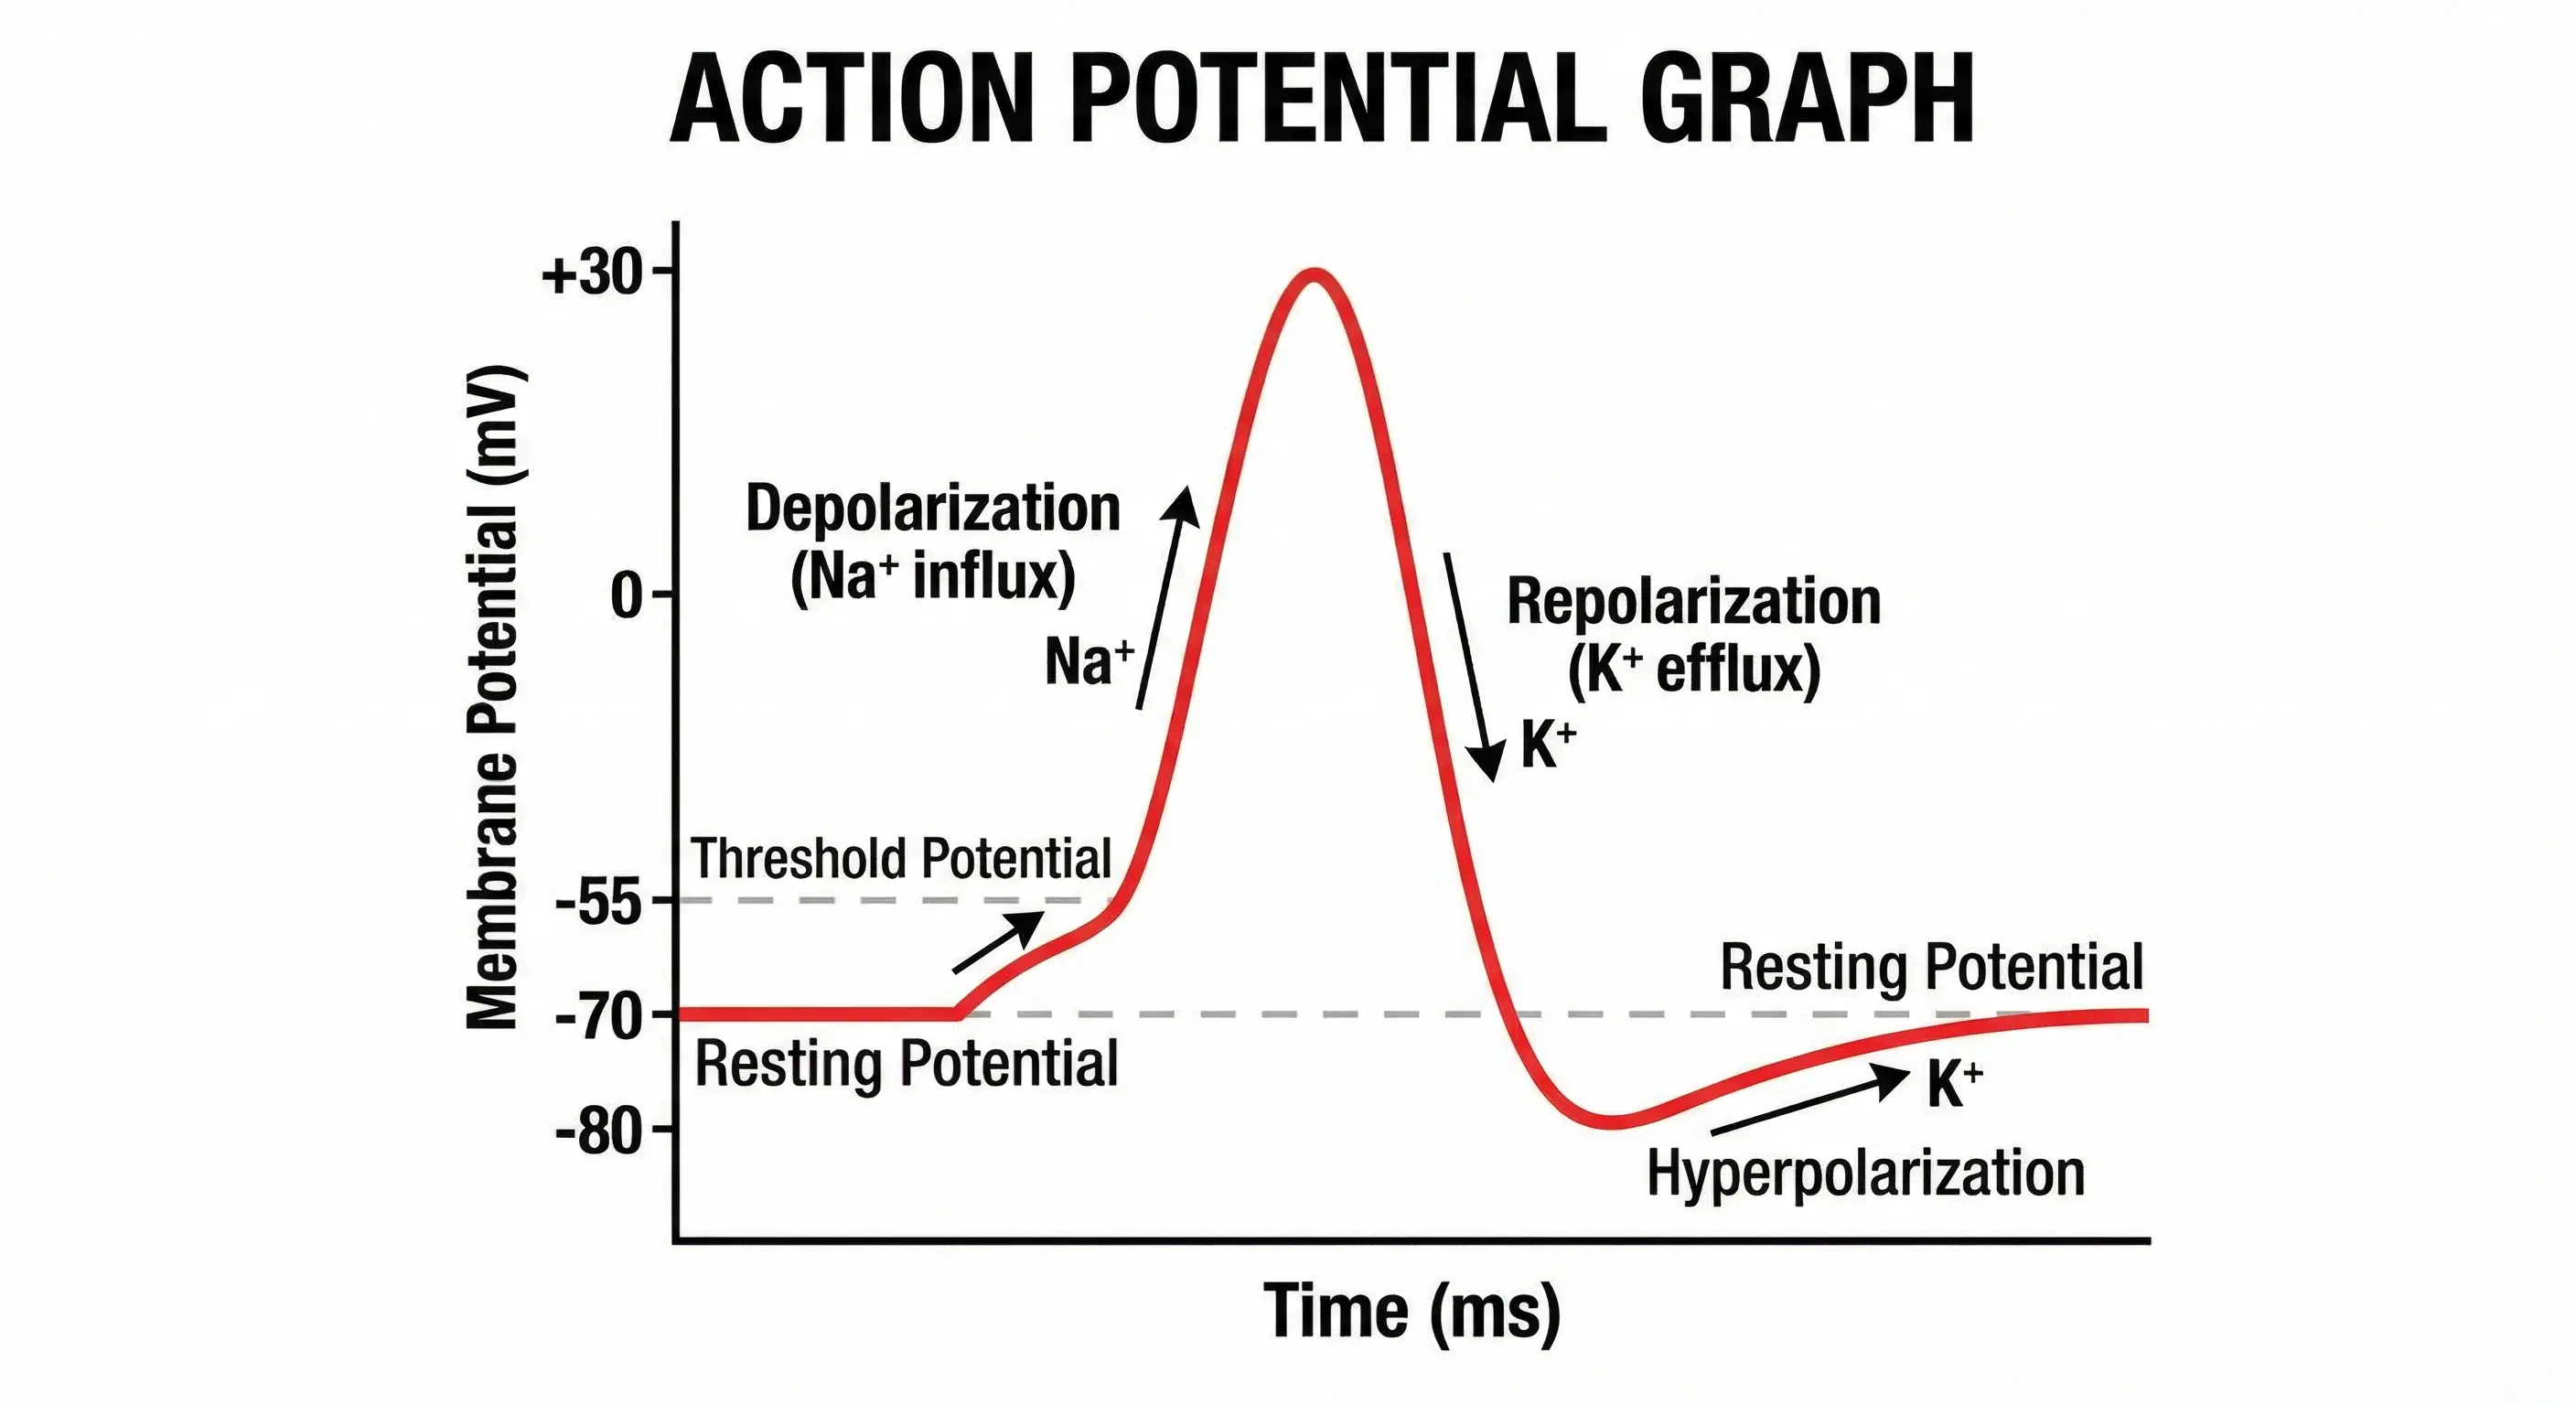
Why it's high-yield: Depolarisation, repolarisation, and hyperpolarisation phases with Na⁺/K⁺ channel gating are high-yield graph questions.
8
Cell Cycle Wheel
Biology
Cell Cycle and Cell Division · Class 11, Ch. 10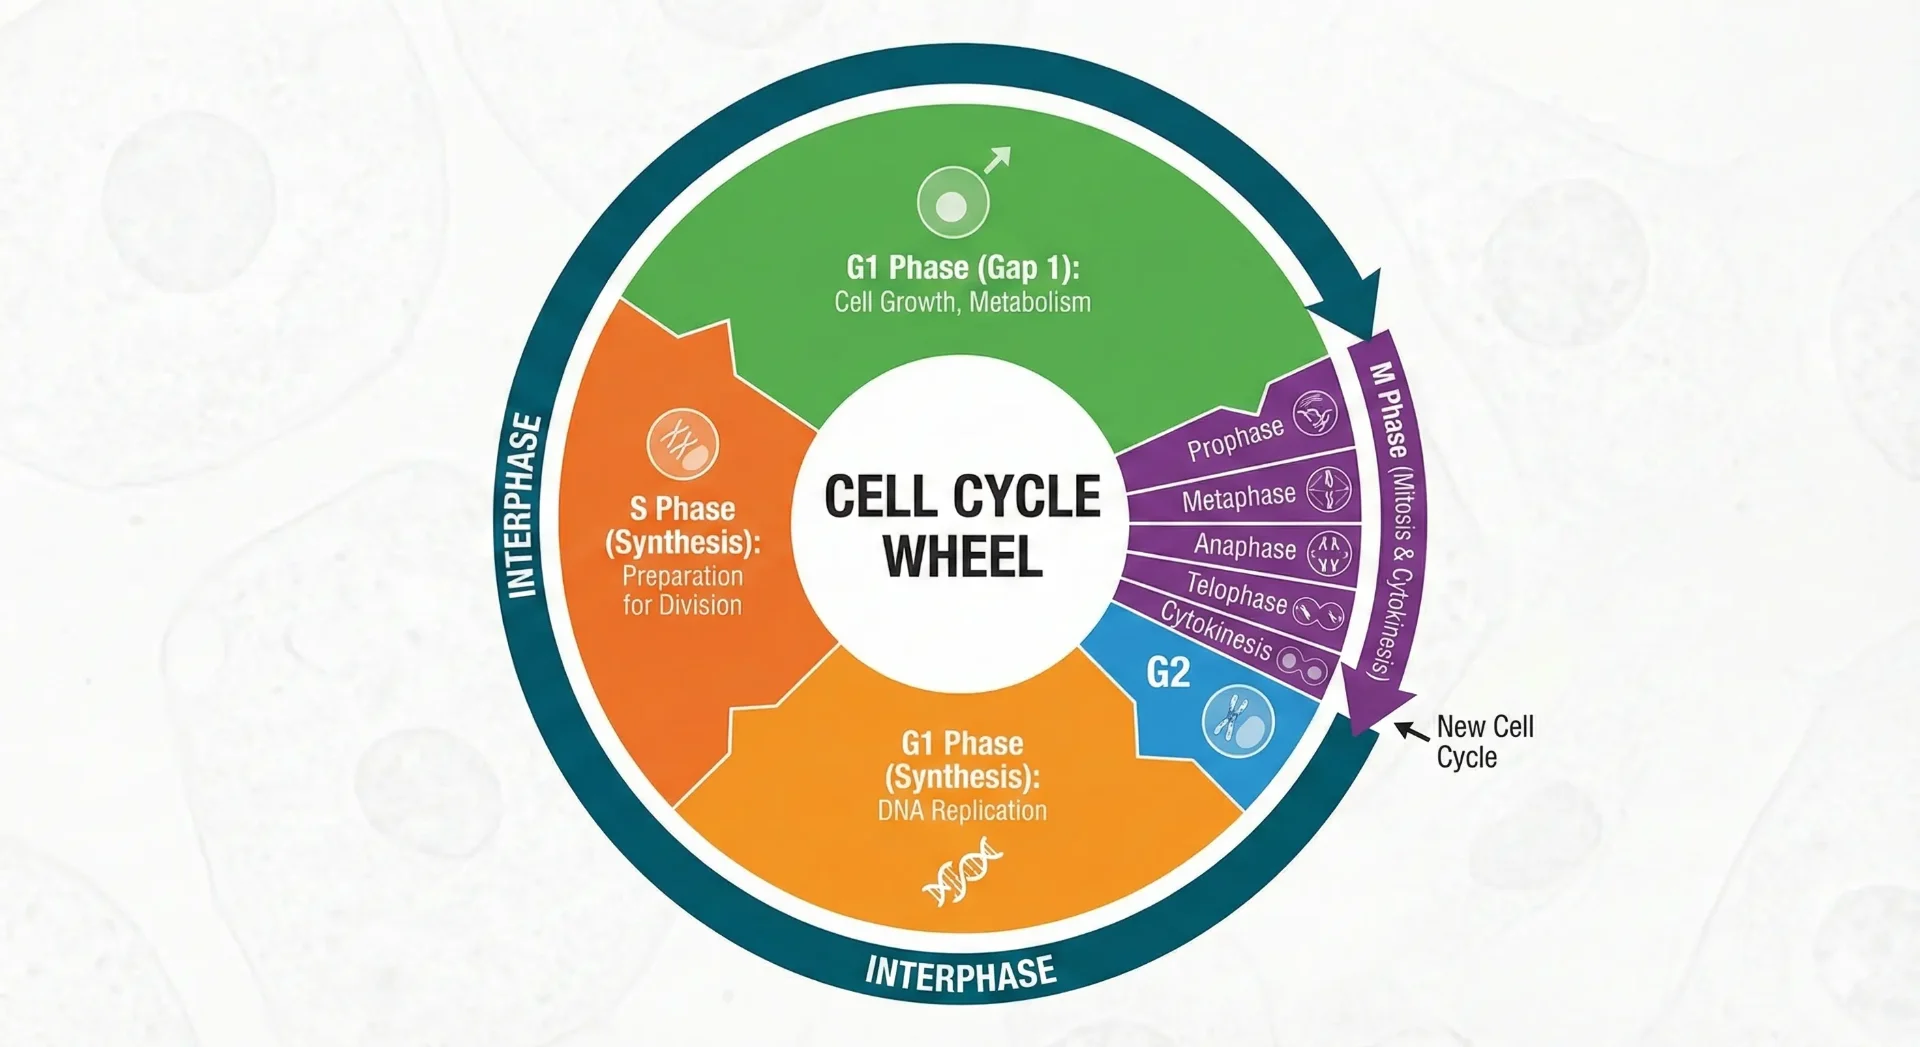
Why it's high-yield: G1, S, G2, M phase duration ratios plus checkpoint signaling (p53, CDKs) — staple NEET questions.
9
Oxygen-Haemoglobin Dissociation Curve
Biology
Breathing and Exchange of Gases · Class 11, Ch. 17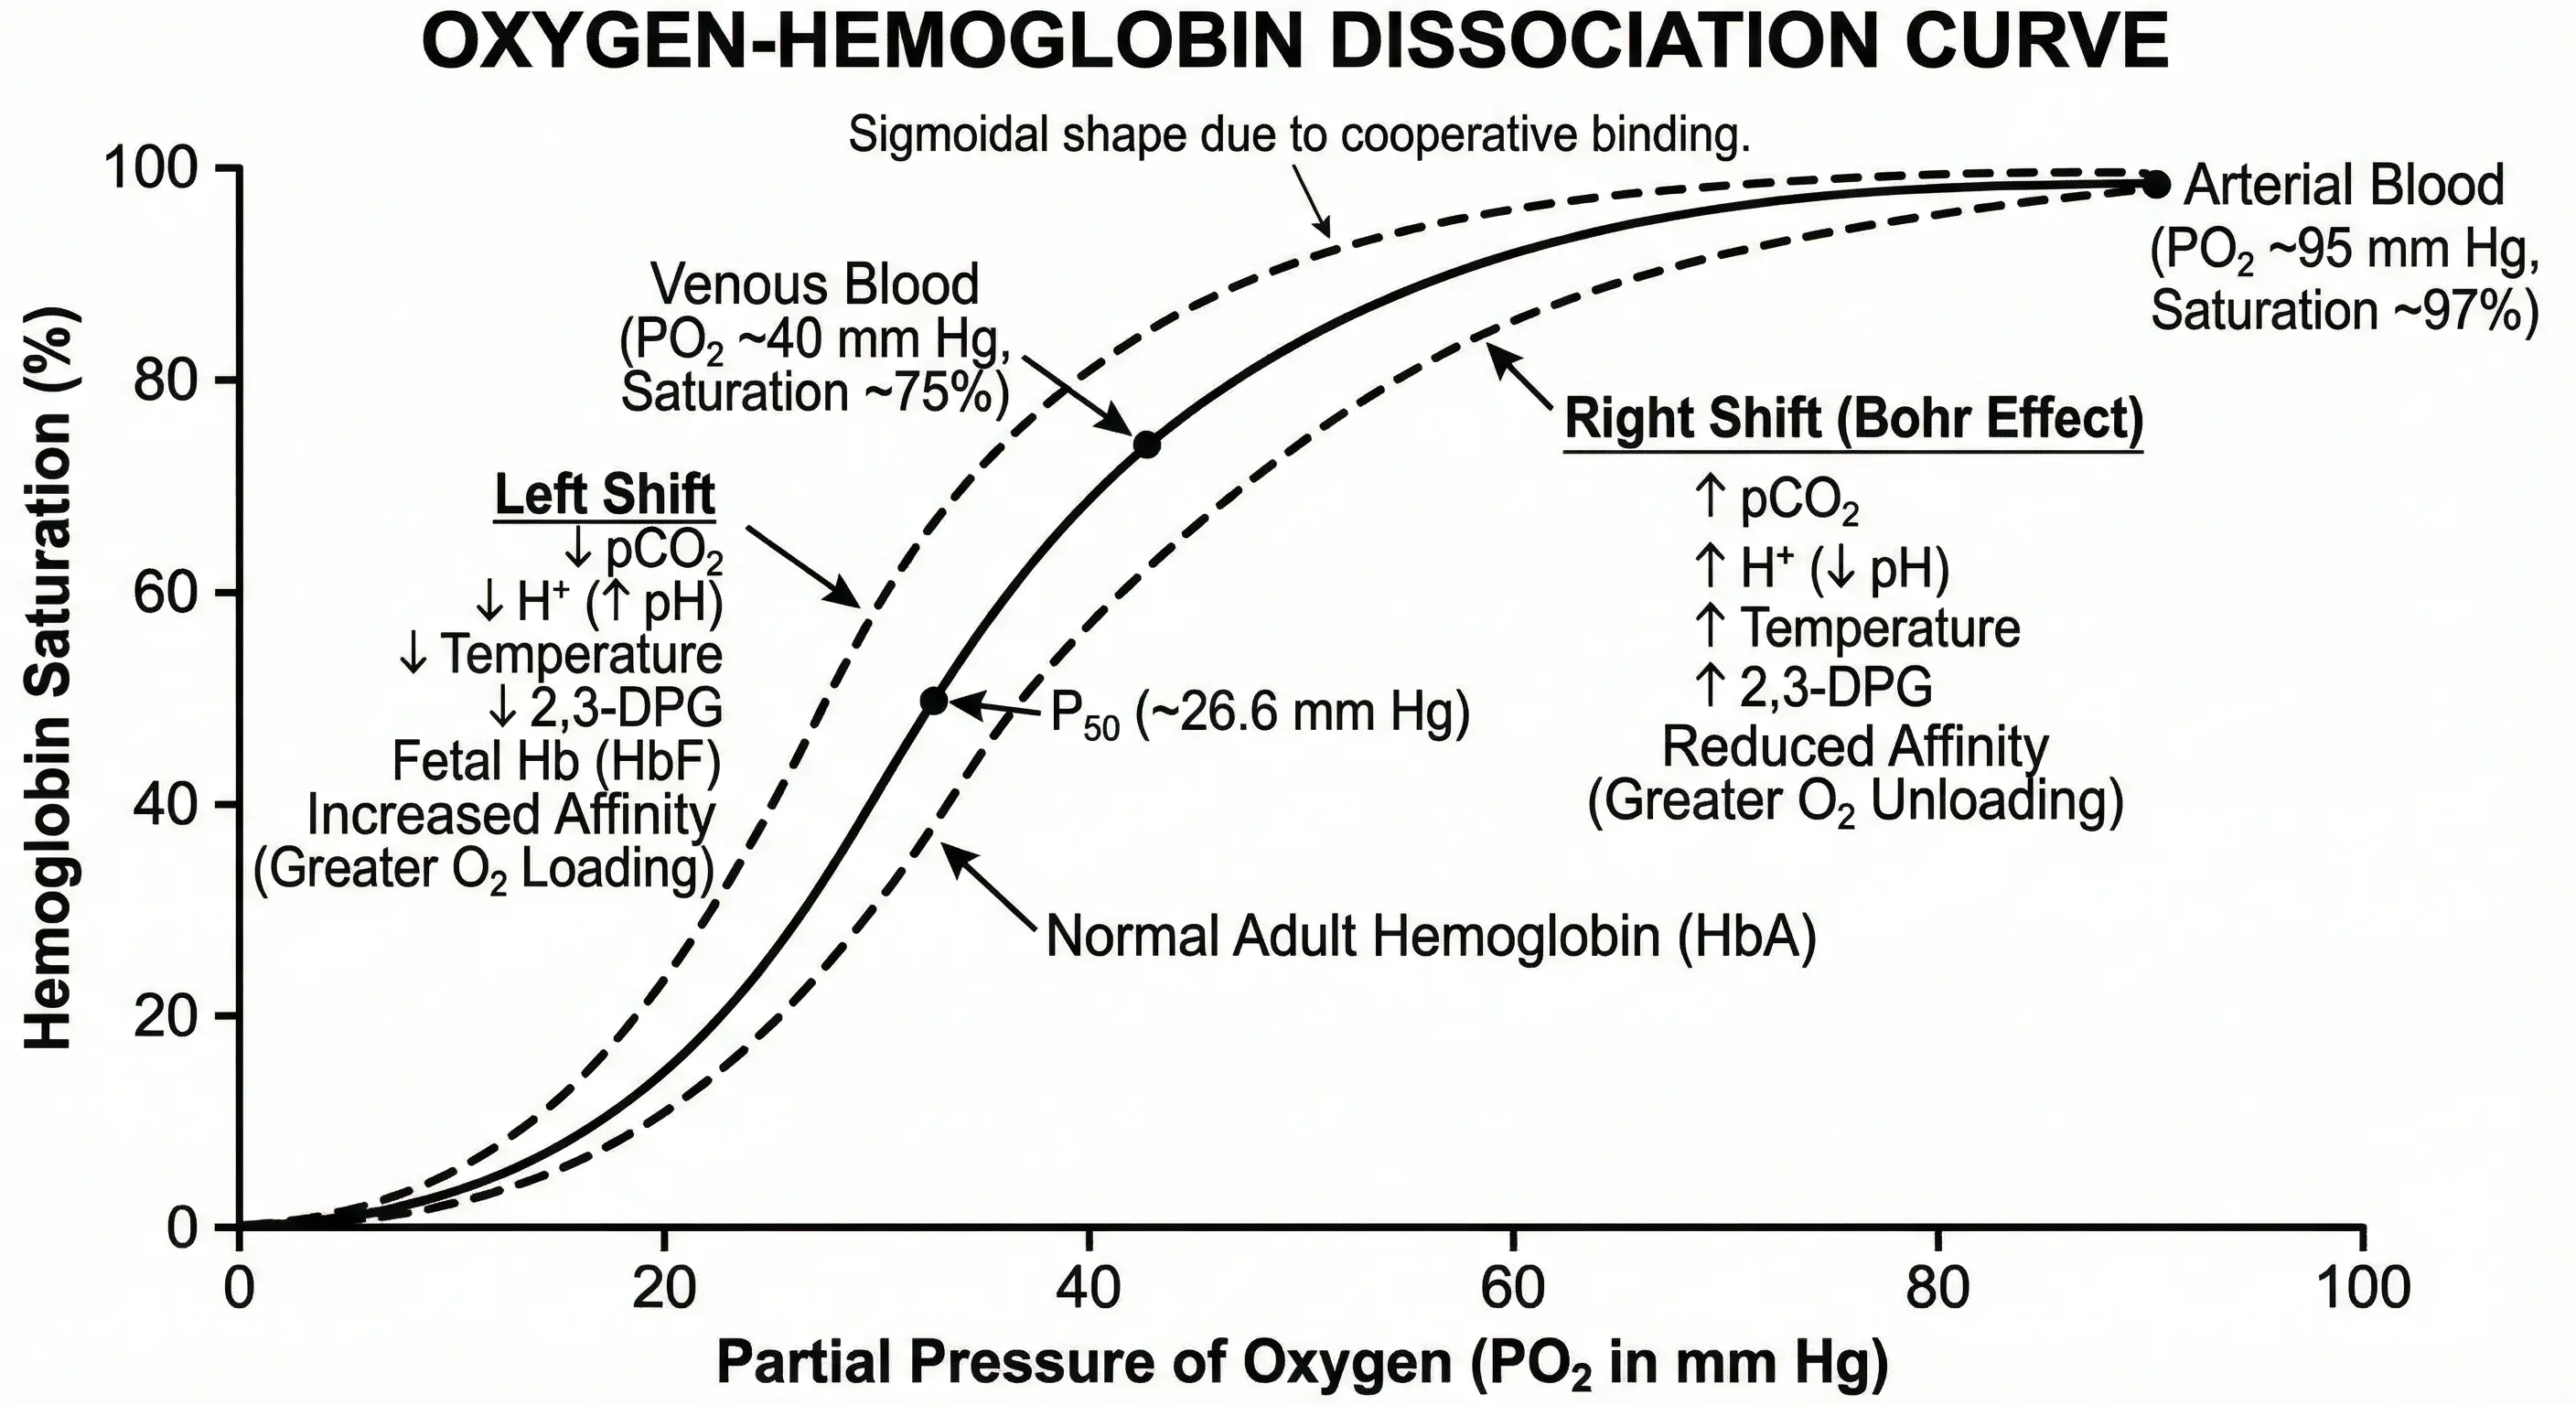
Why it's high-yield: Sigmoid curve shape, Bohr effect shifts, and factors affecting O₂ affinity are tested as graph-interpretation MCQs.
10
Menstrual Cycle Overview
Biology
Human Reproduction · Class 12, Ch. 2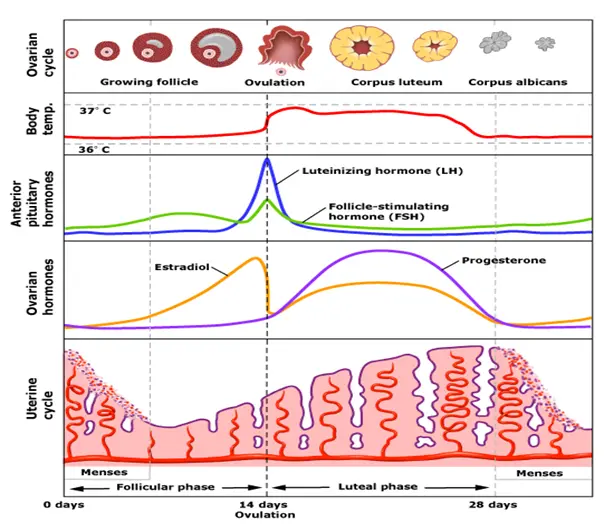
Why it's high-yield: NEET often asks you to identify which hormone peaks first or what happens to the Corpus Luteum if fertilization fails.
11
Z-Scheme of Photosynthesis
Biology
Photosynthesis in Higher Plants · Class 11, Ch. 13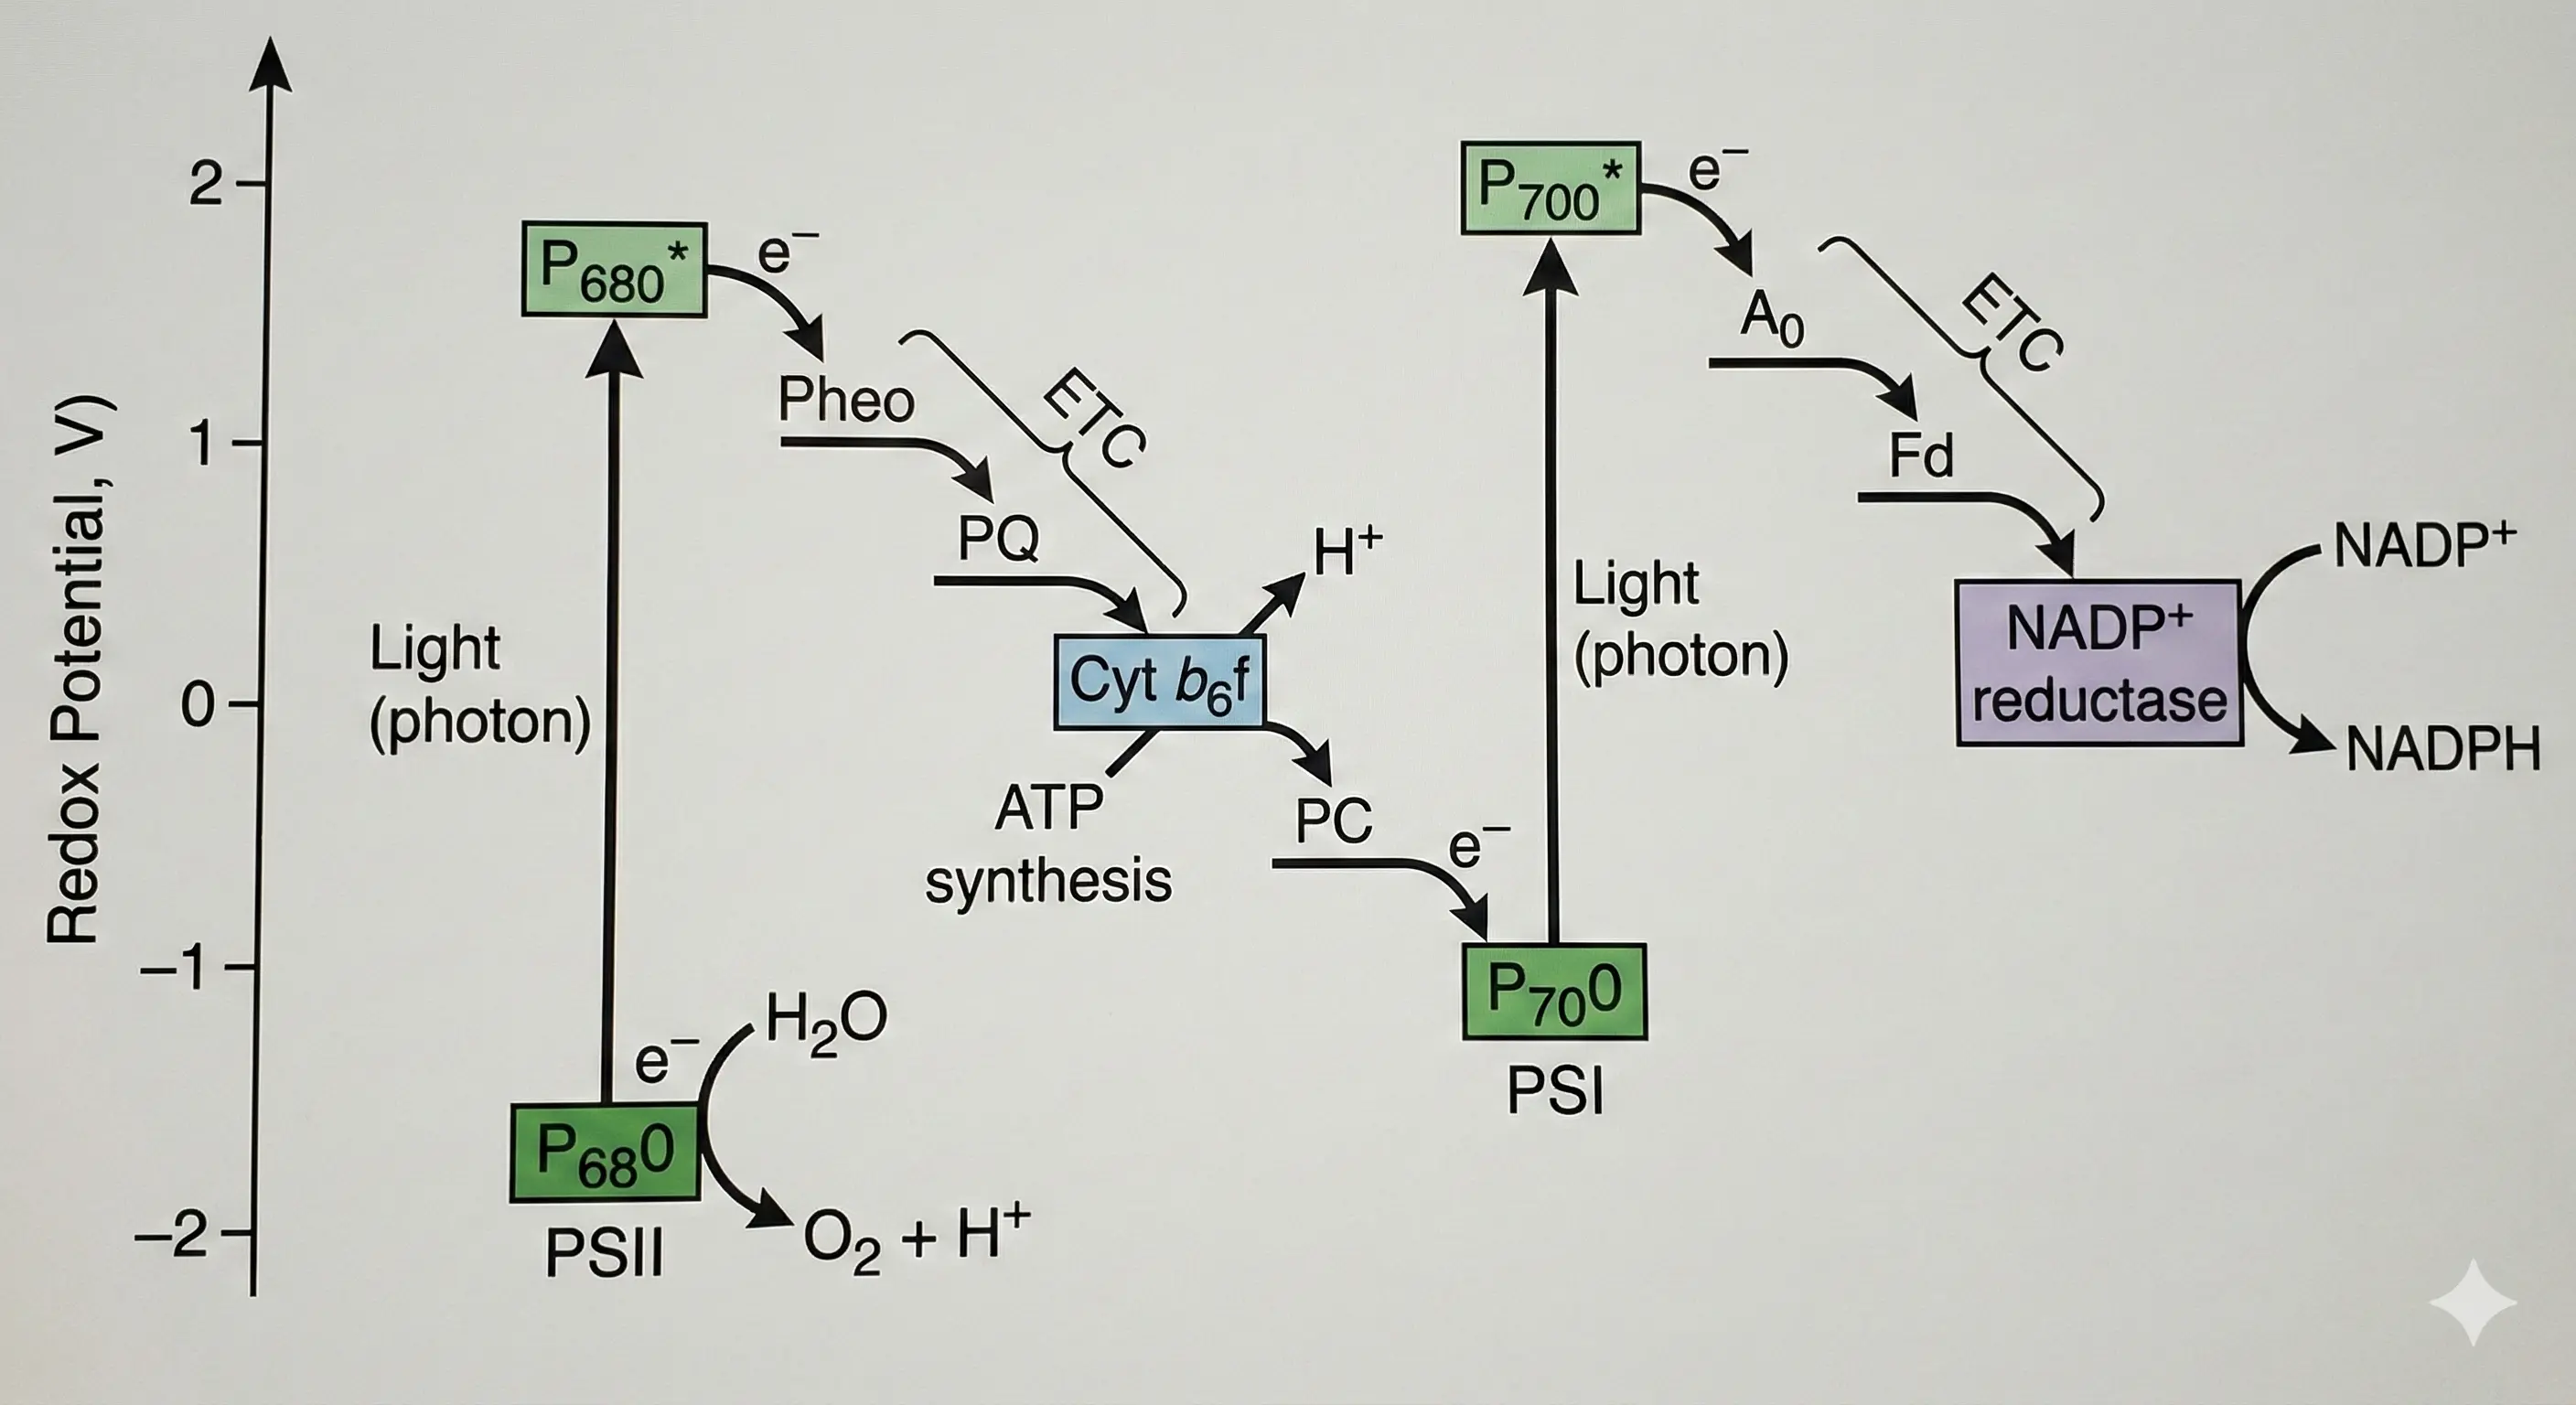
Why it's high-yield: PS II → PS I electron flow, plastoquinone, and NADP⁺ reductase pathway — tested as electron transport chain MCQs.
Continue with Photosynthesis in Higher Plants notes · Photosynthesis in Higher Plants MCQs · Photosynthesis in Higher Plants audio revision.
12
Glycolysis Pathway
Biology
Respiration in Plants · Class 11, Ch. 14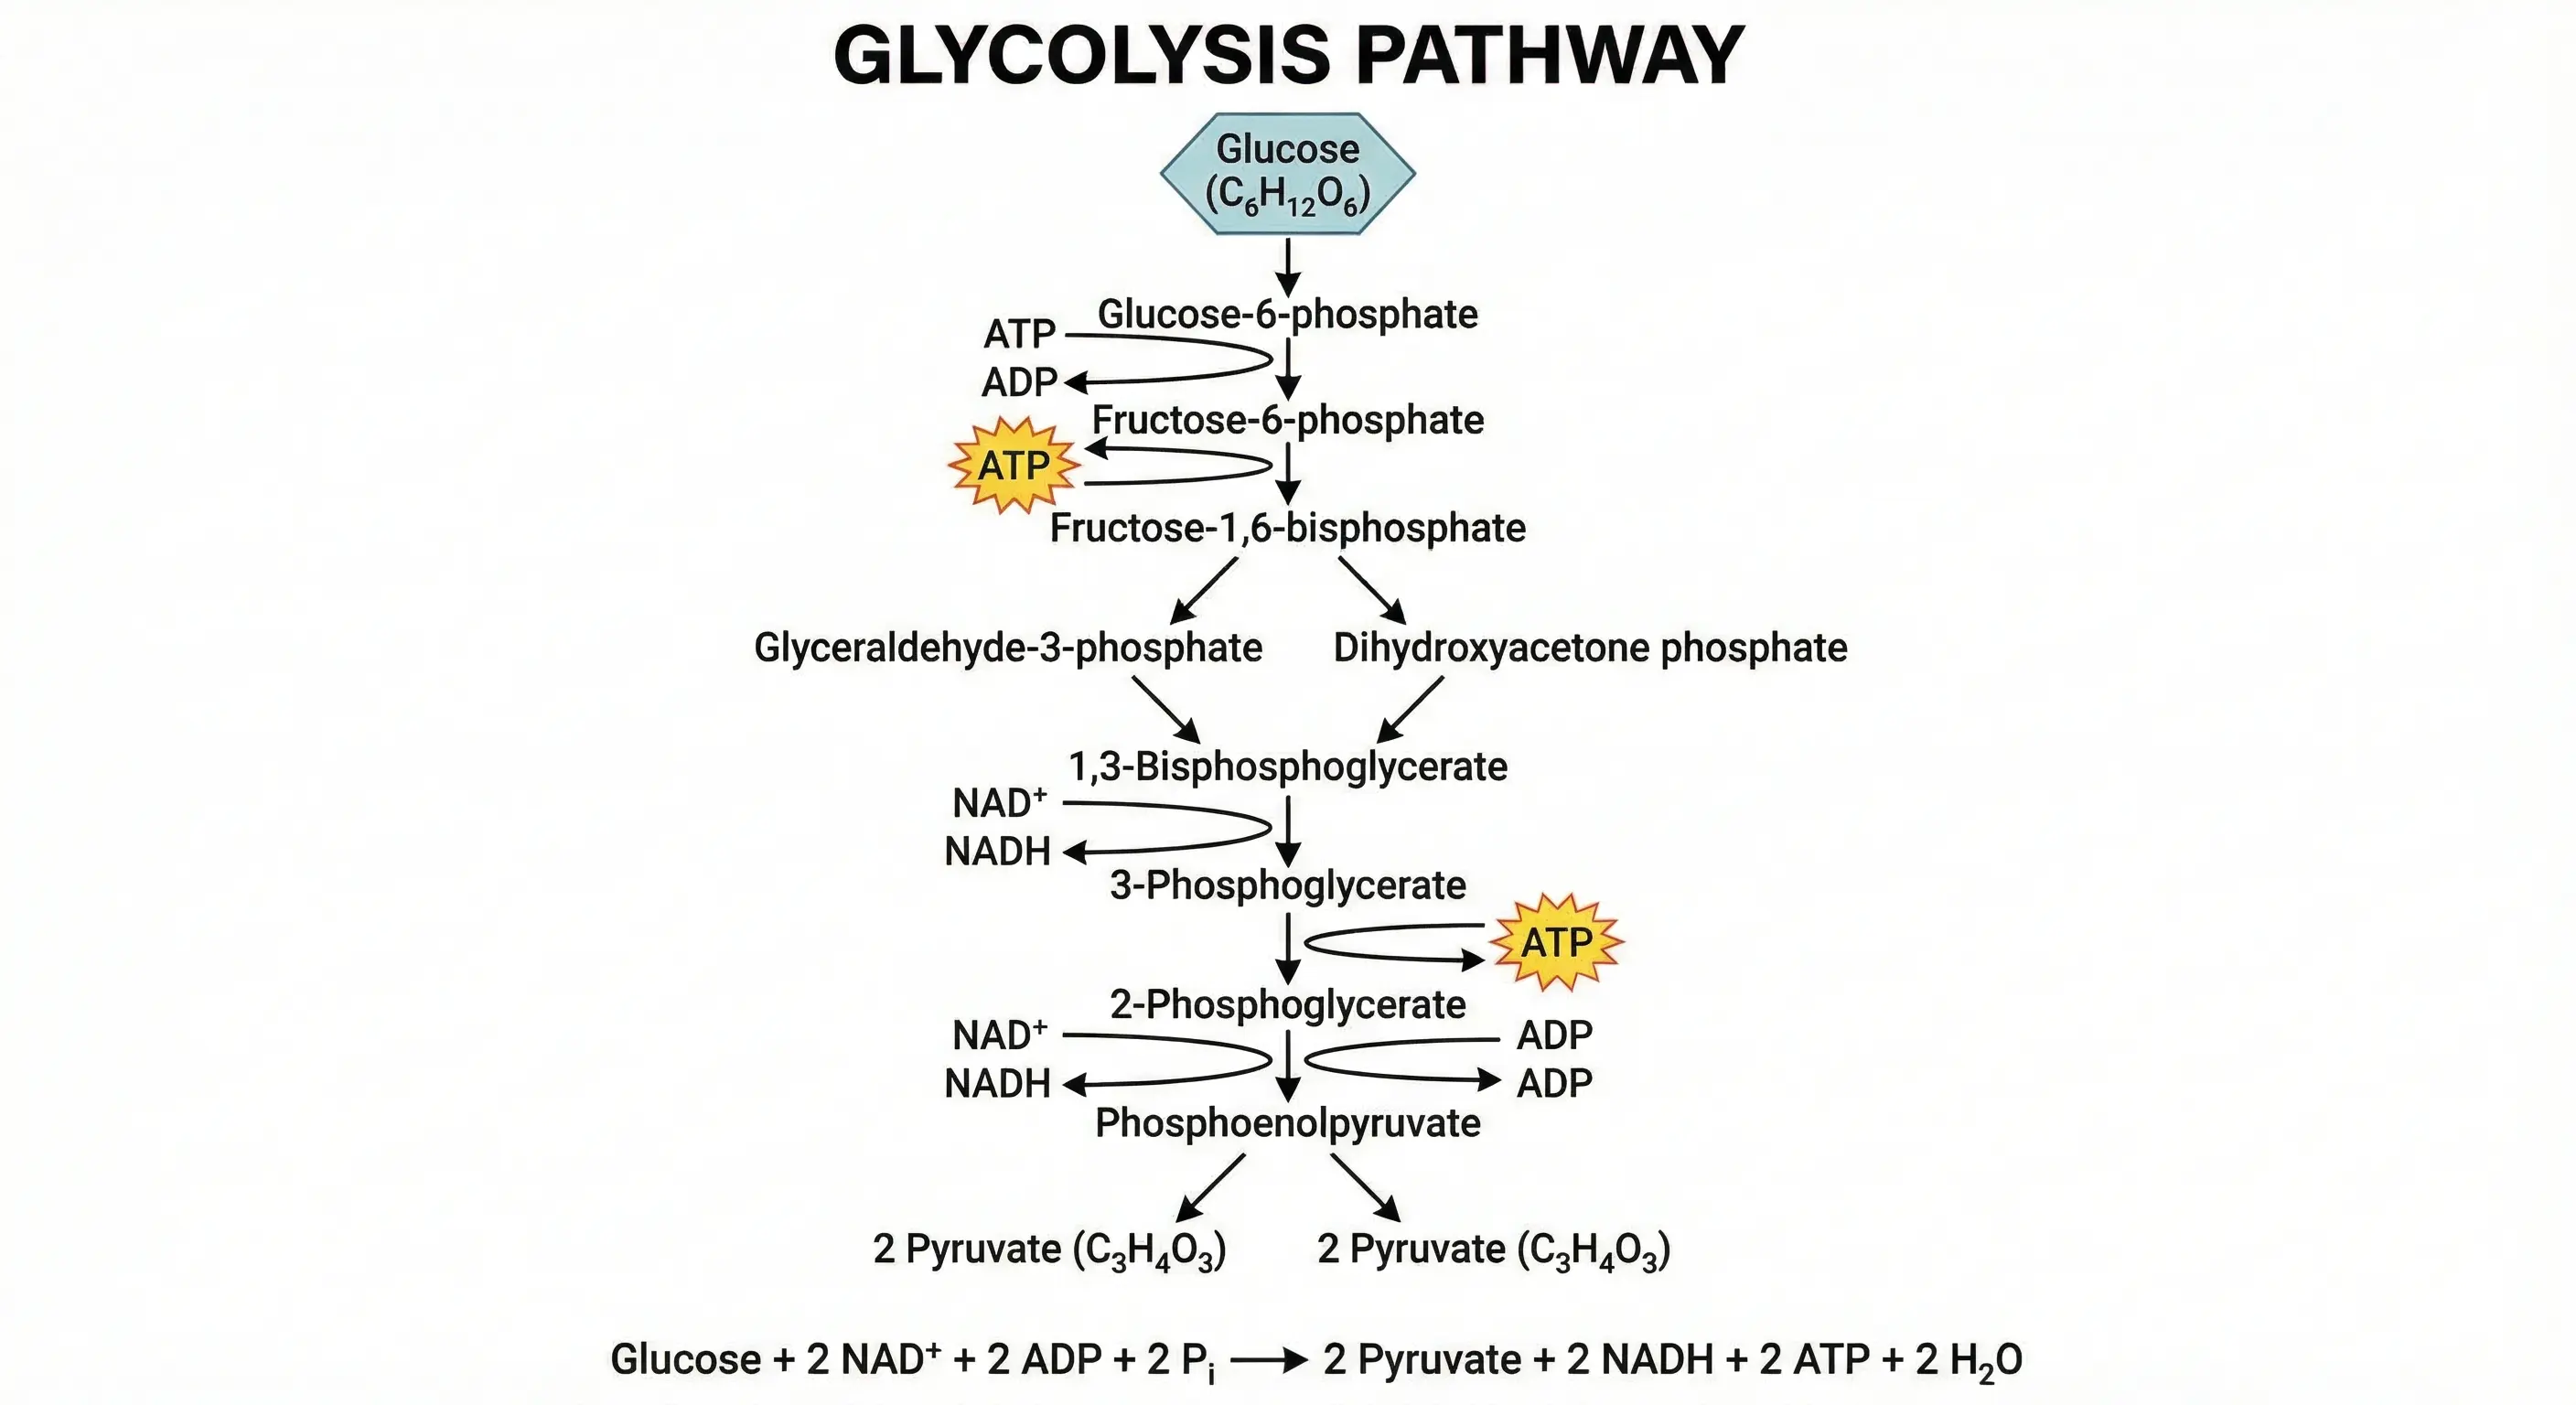
Why it's high-yield: Glucose to pyruvate conversion steps, ATP yield, and key regulatory enzymes like phosphofructokinase.
13
Electron Transport System
Biology
Respiration in Plants · Class 11, Ch. 14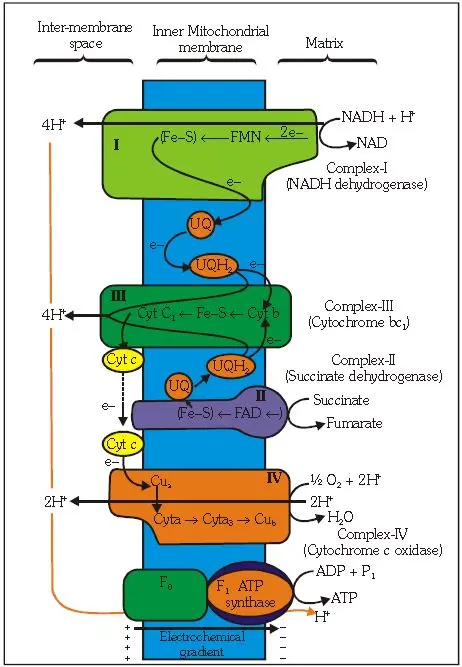
Why it's high-yield: You must know which complex does not pump protons (Complex II) and where Cytochrome c is located (outer surface of the inner membrane).
14
PCR Thermal Cycling
Biology
Biotechnology: Principles · Class 12, Ch. 11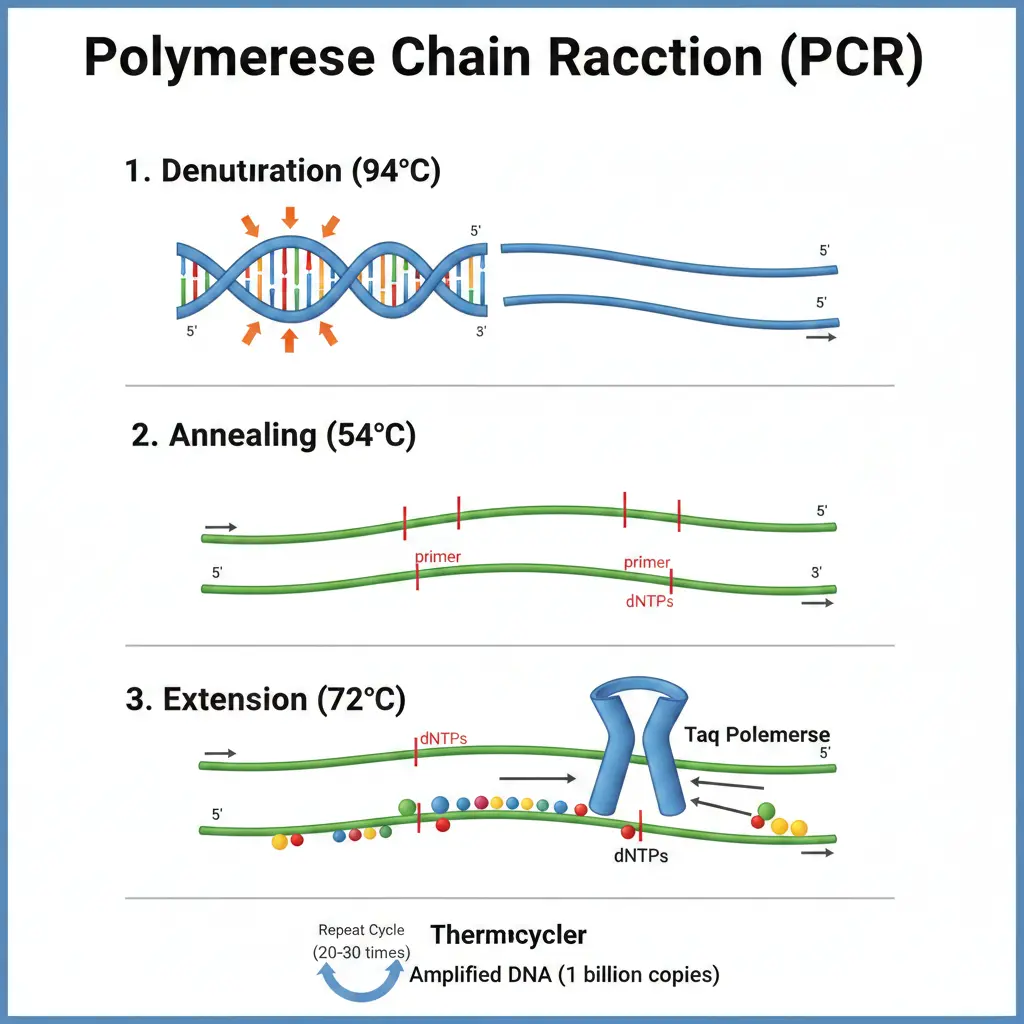
Why it's high-yield: Denaturation, annealing, extension temperatures and Taq polymerase role — direct MCQs on temperature ranges.
15
Periodic Trends Map
Chemistry
Classification of Elements · Class 11, Ch. 3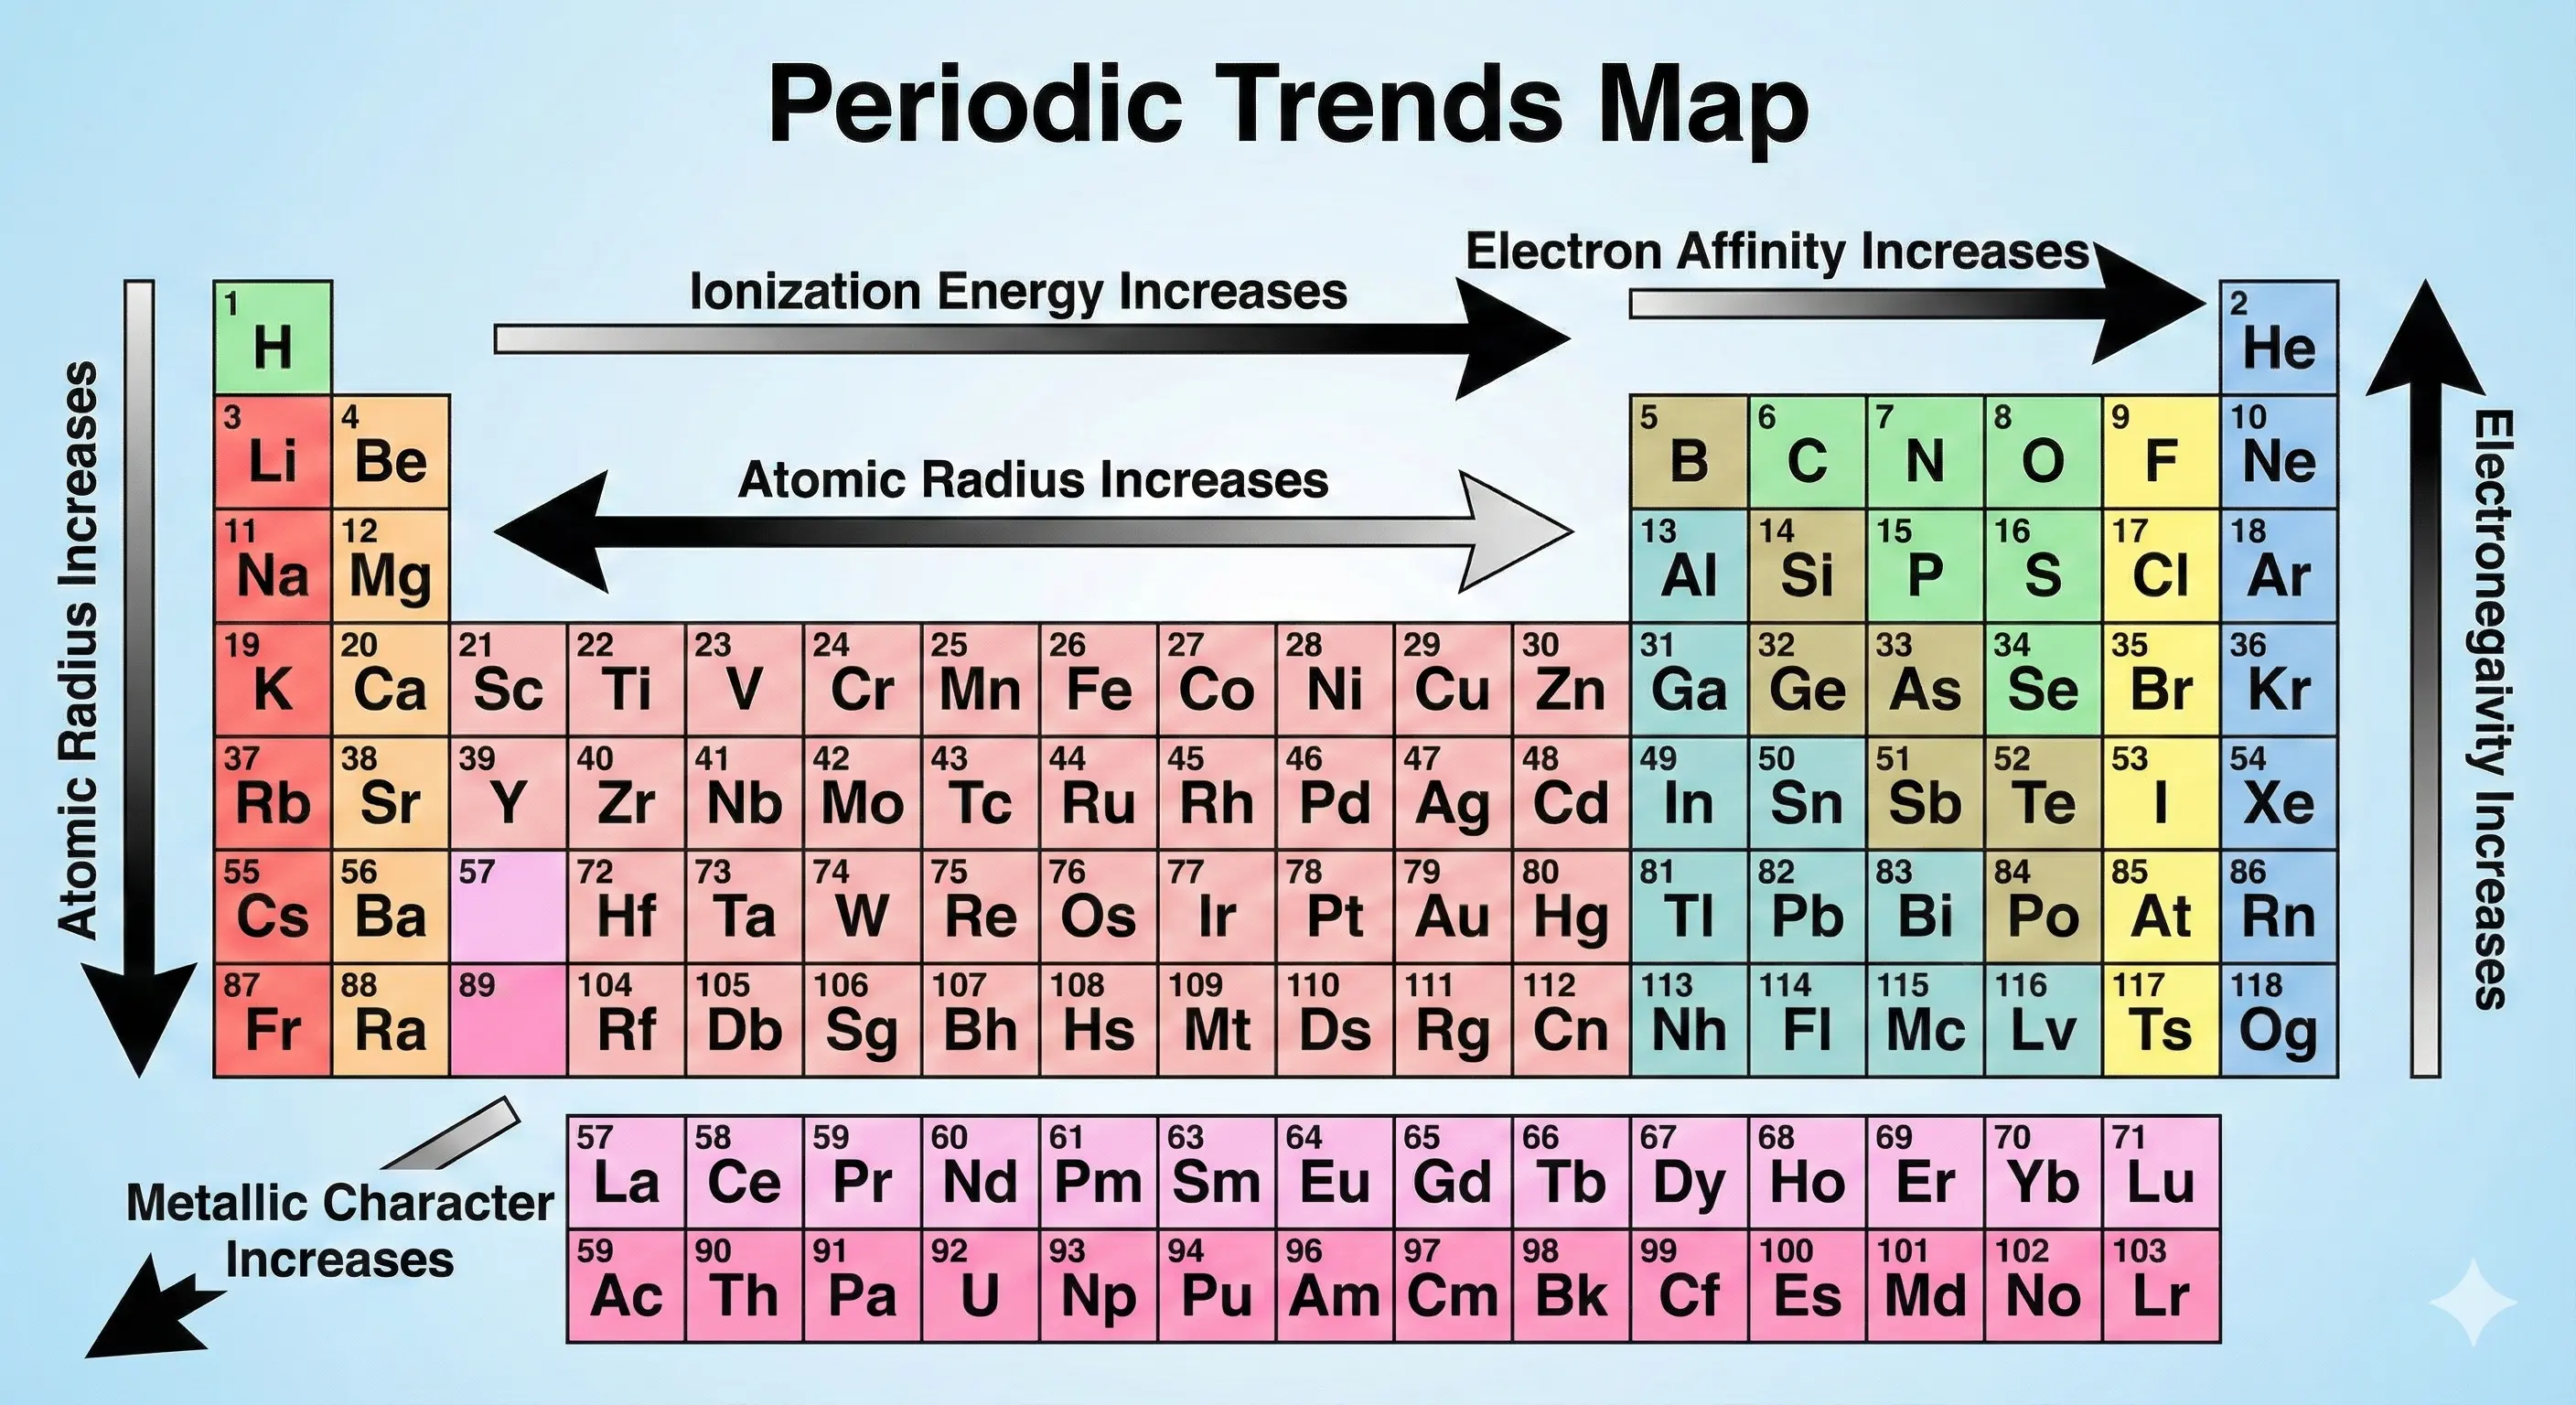
Why it's high-yield: Ionisation energy, electronegativity, atomic radius trends across periods and groups — fundamental for inorganic MCQs.
16
VSEPR Molecular Geometries
Chemistry
Chemical Bonding · Class 11, Ch. 4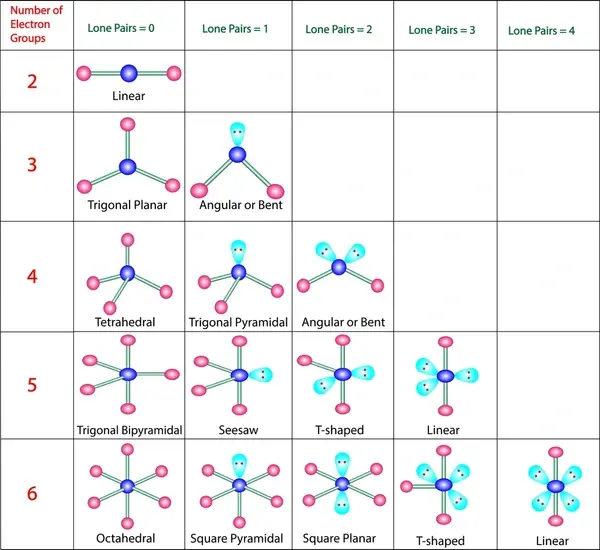
Why it's high-yield: Linear, trigonal, tetrahedral, and octahedral geometries with bond angles — essential for predicting molecular shapes.
17
Electrochemical Cell (Galvanic)
Chemistry
Electrochemistry · Class 12, Ch. 3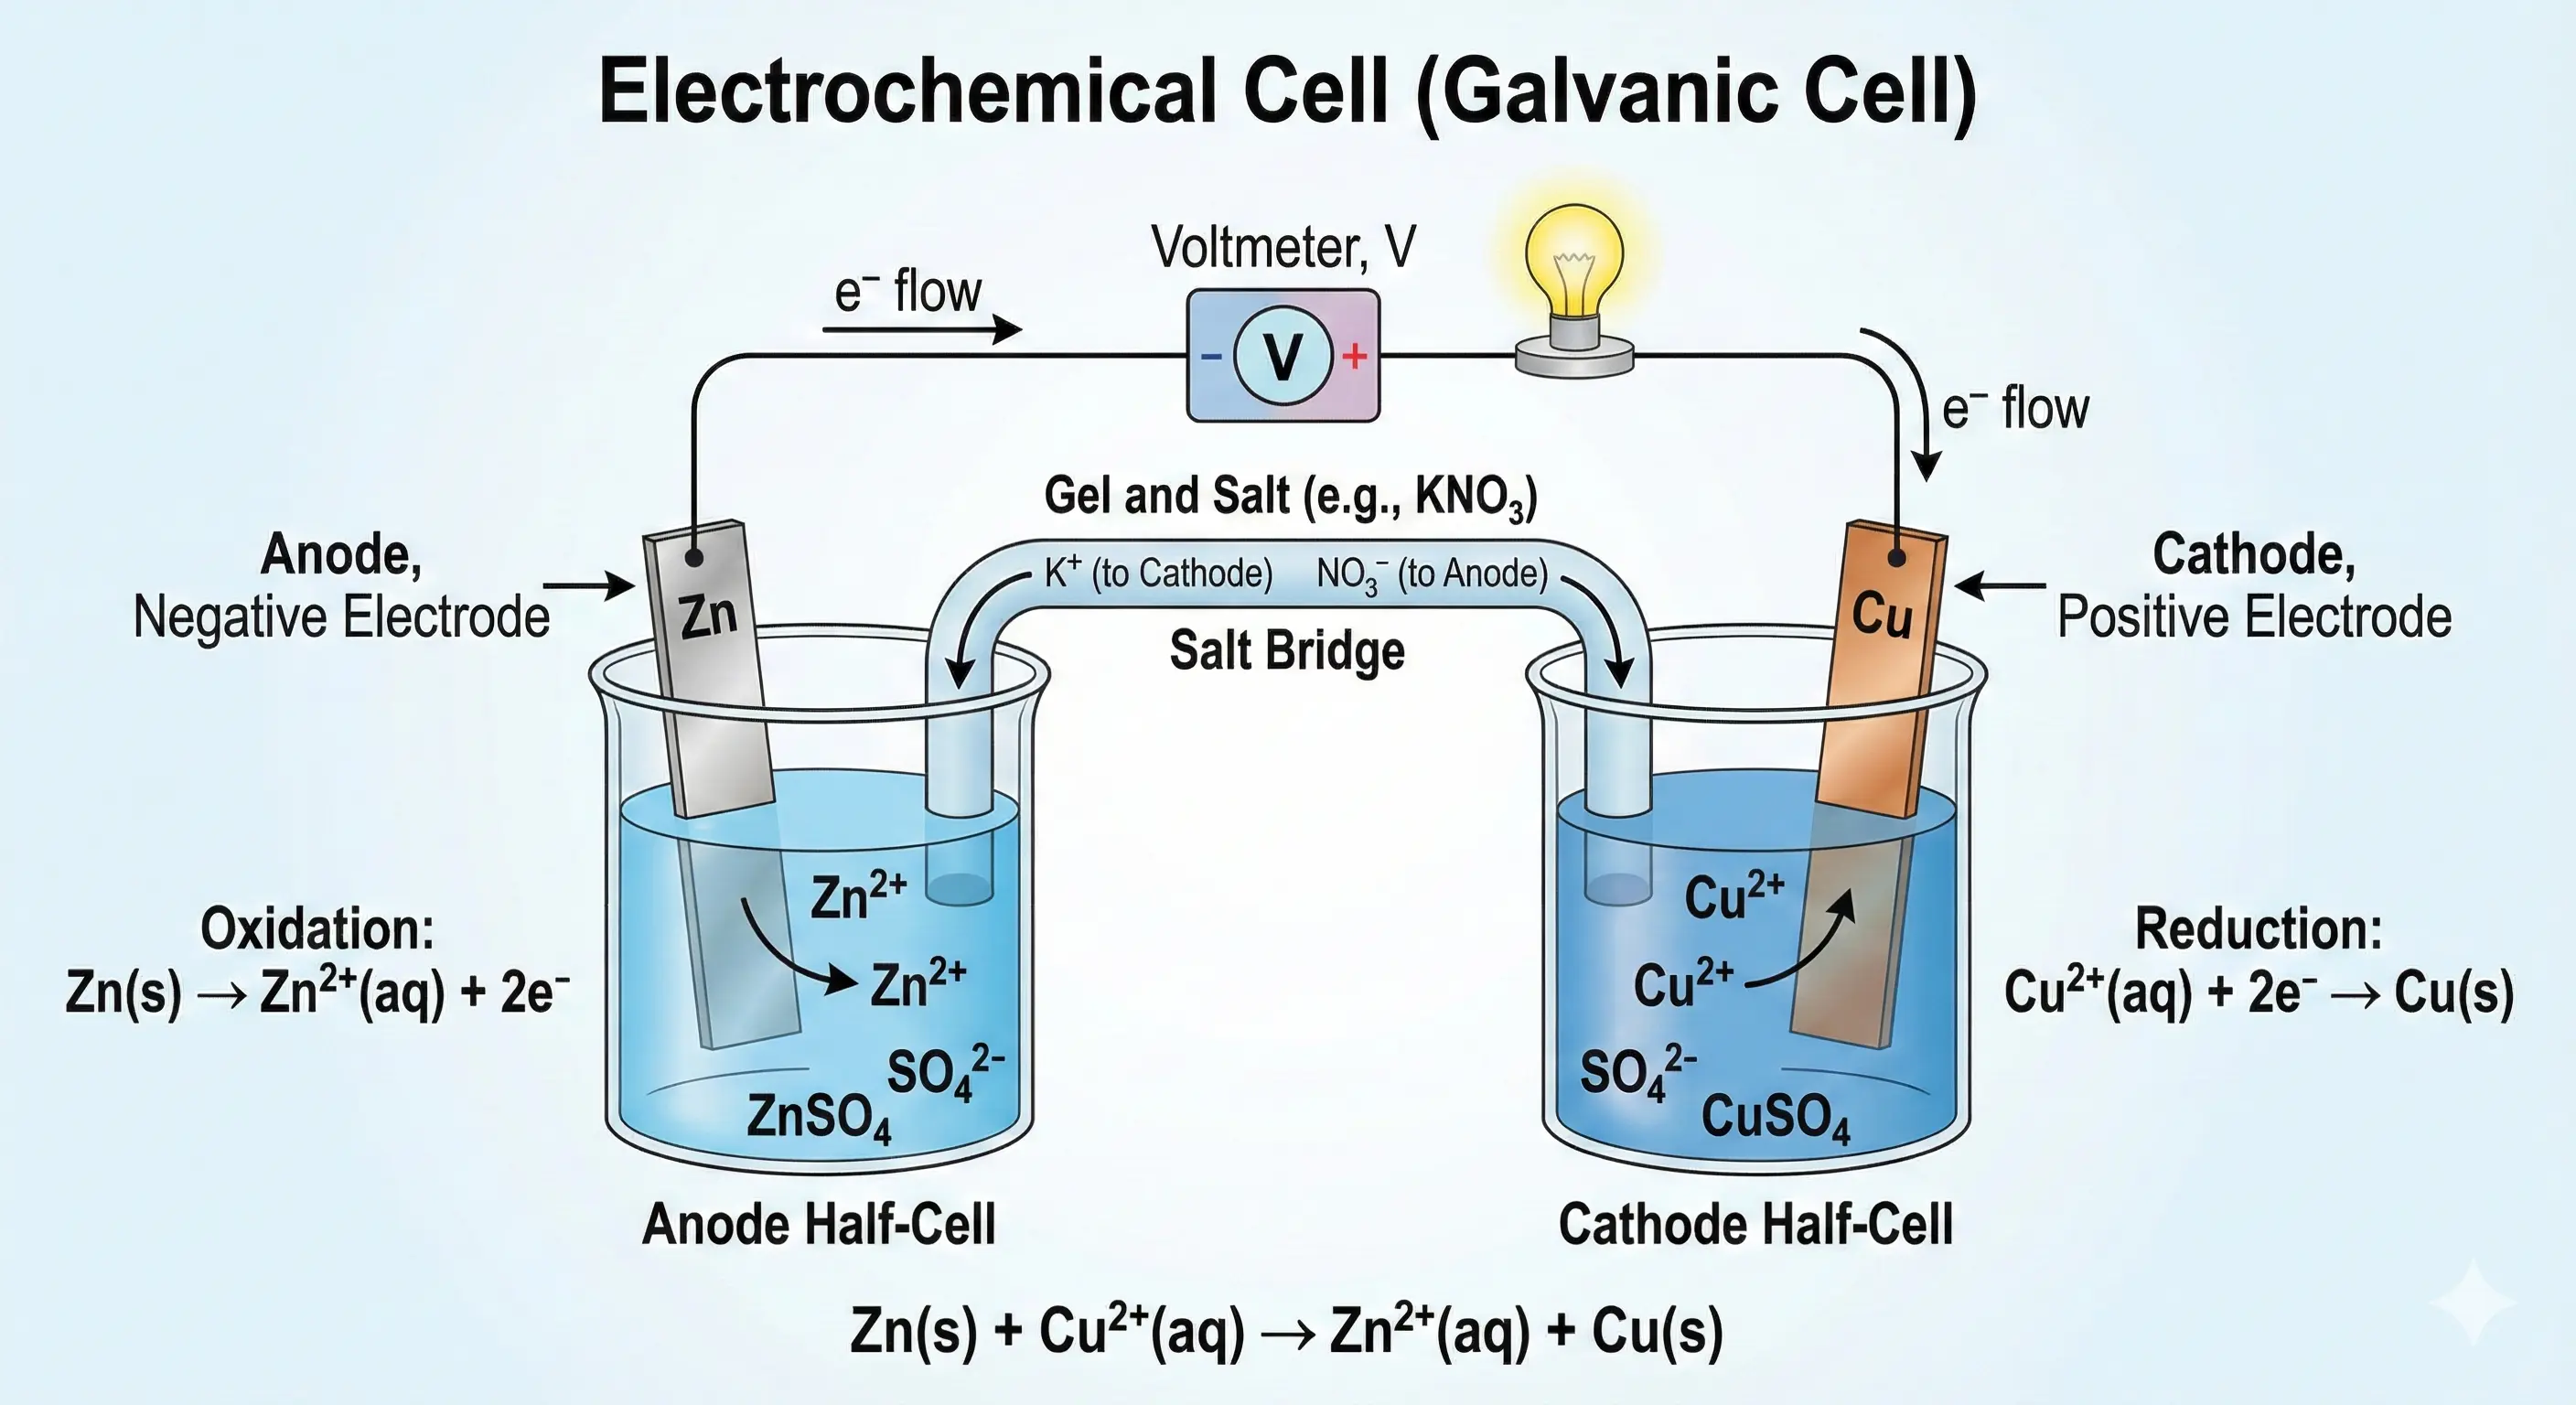
Why it's high-yield: Anode, cathode, salt bridge, electron flow direction — tested as labelling and conceptual MCQs.
18
Energy Level Diagram (MO Theory)
Chemistry
Chemical Bonding · Class 11, Ch. 4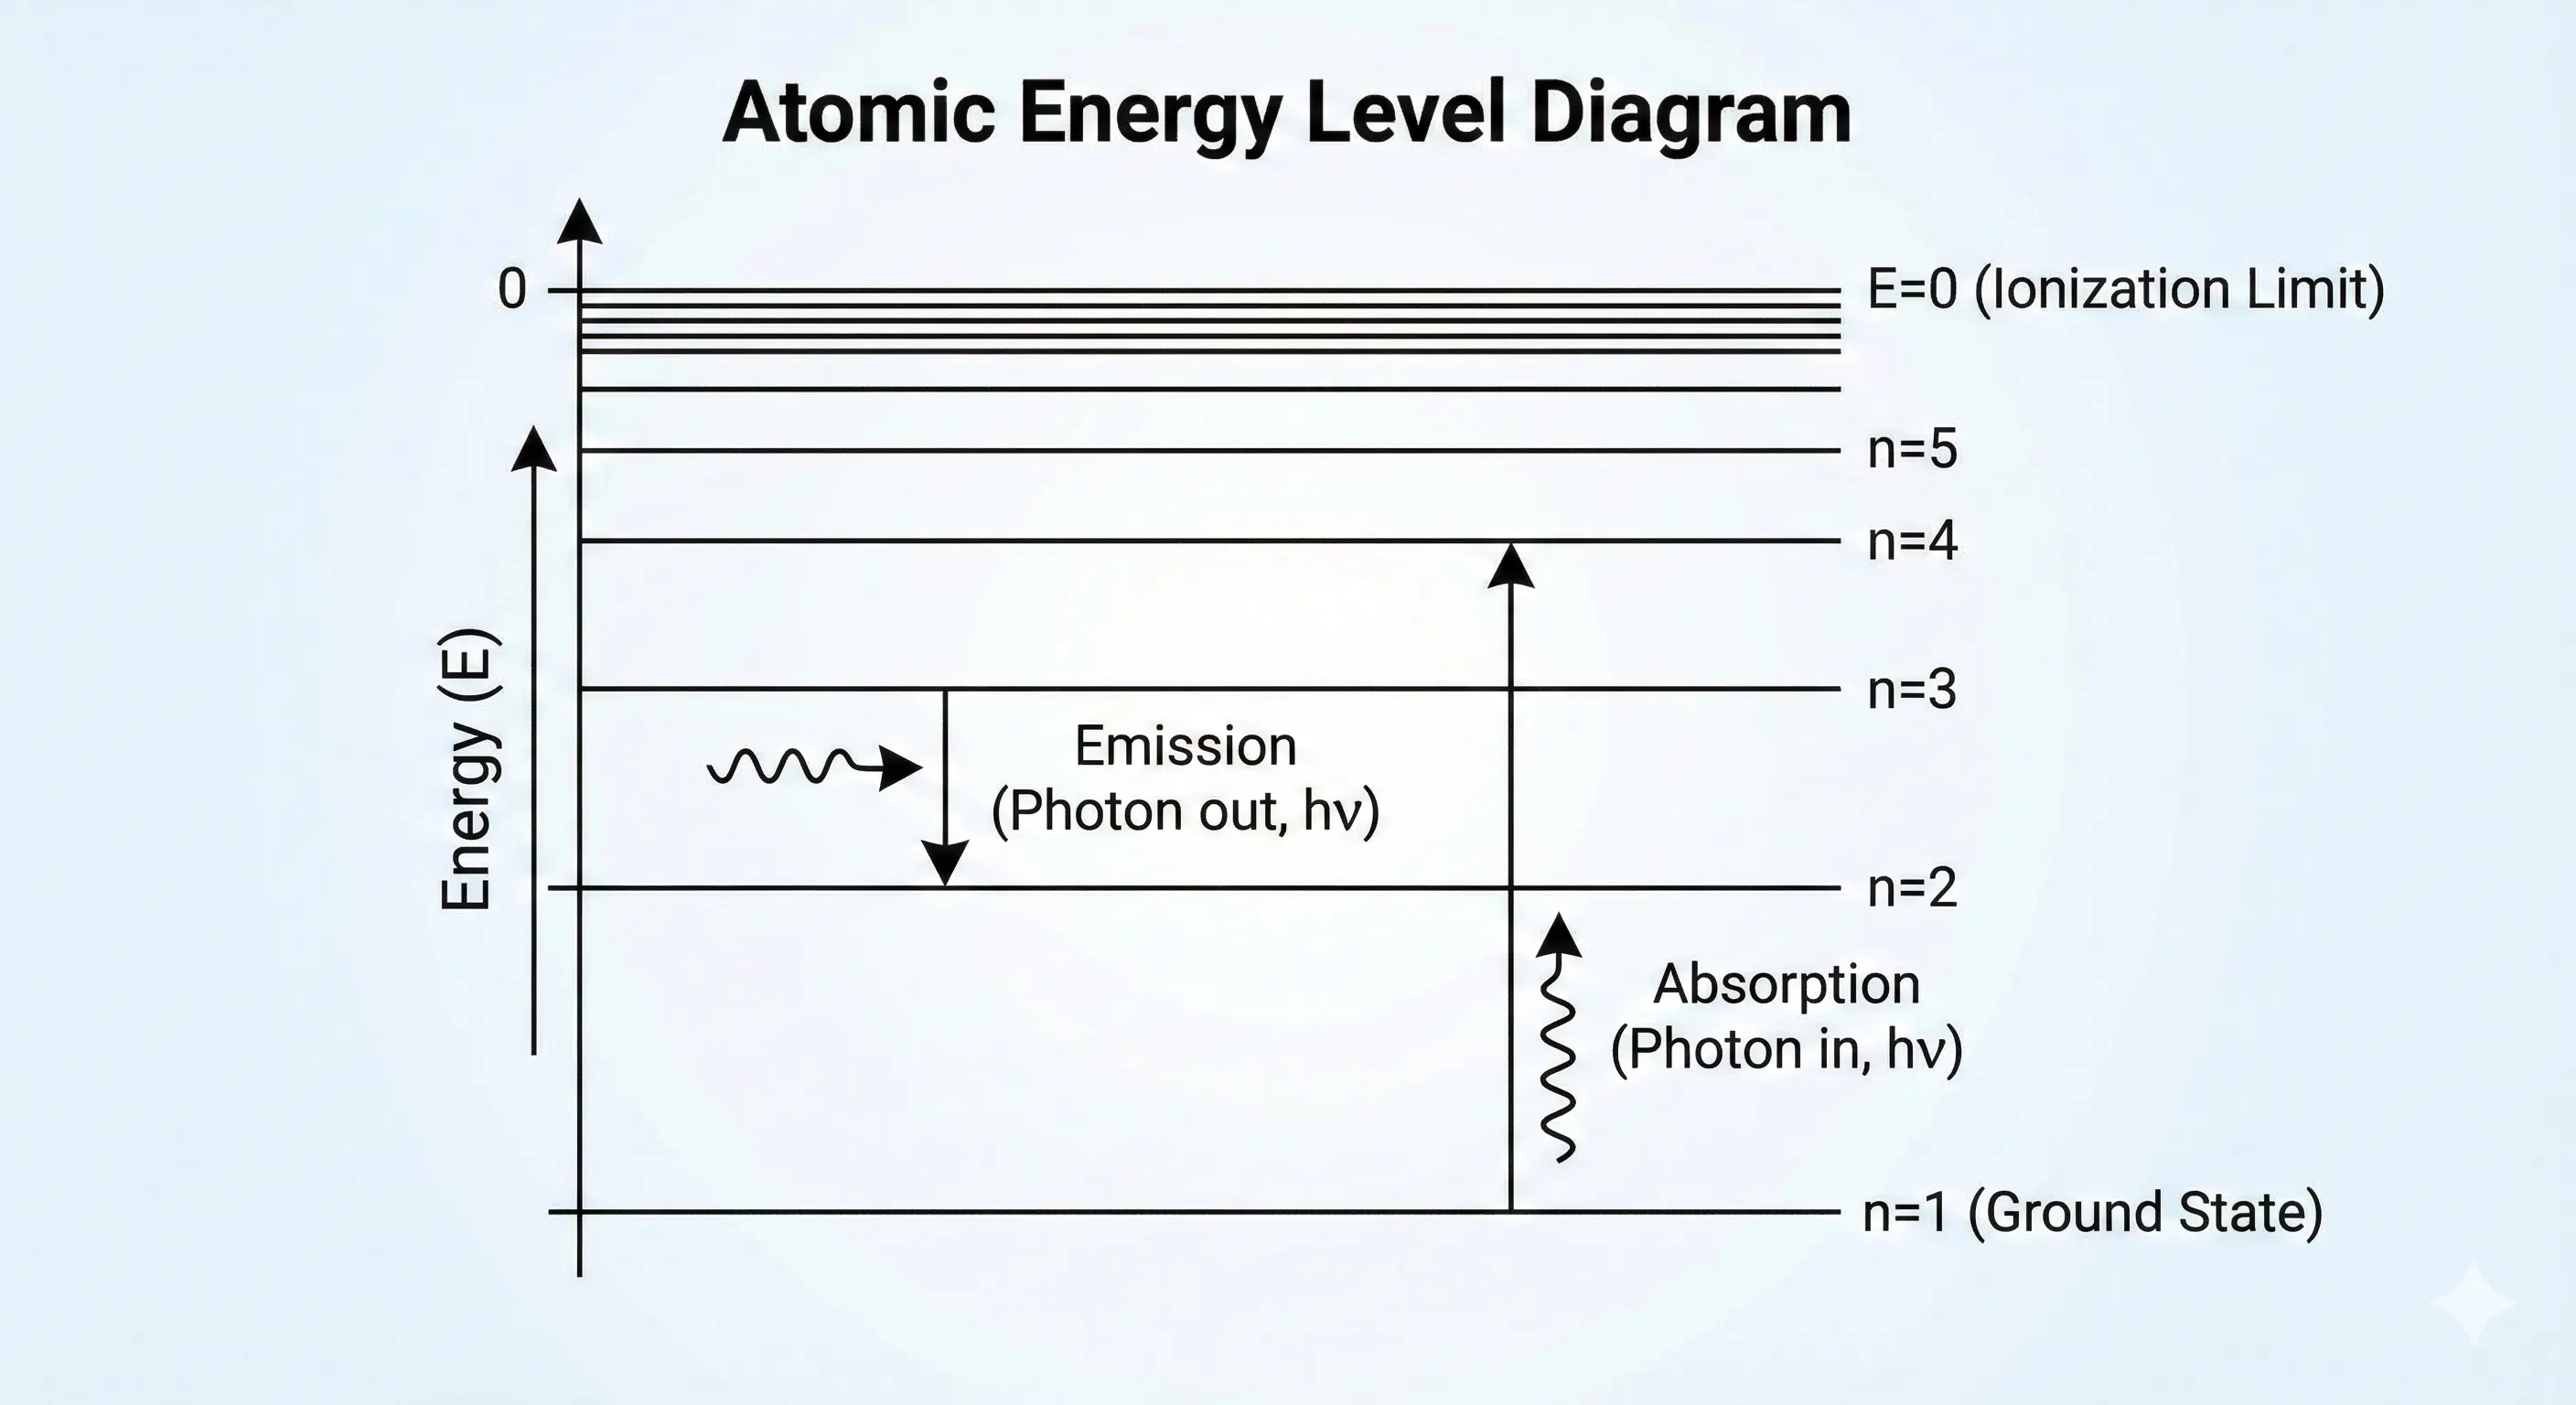
Why it's high-yield: σ and π molecular orbital filling order, bond order calculation — high-yield for bonding MCQs.
19
Stress-Strain Curve
Physics
Mechanical Properties of Solids · Class 11, Ch. 9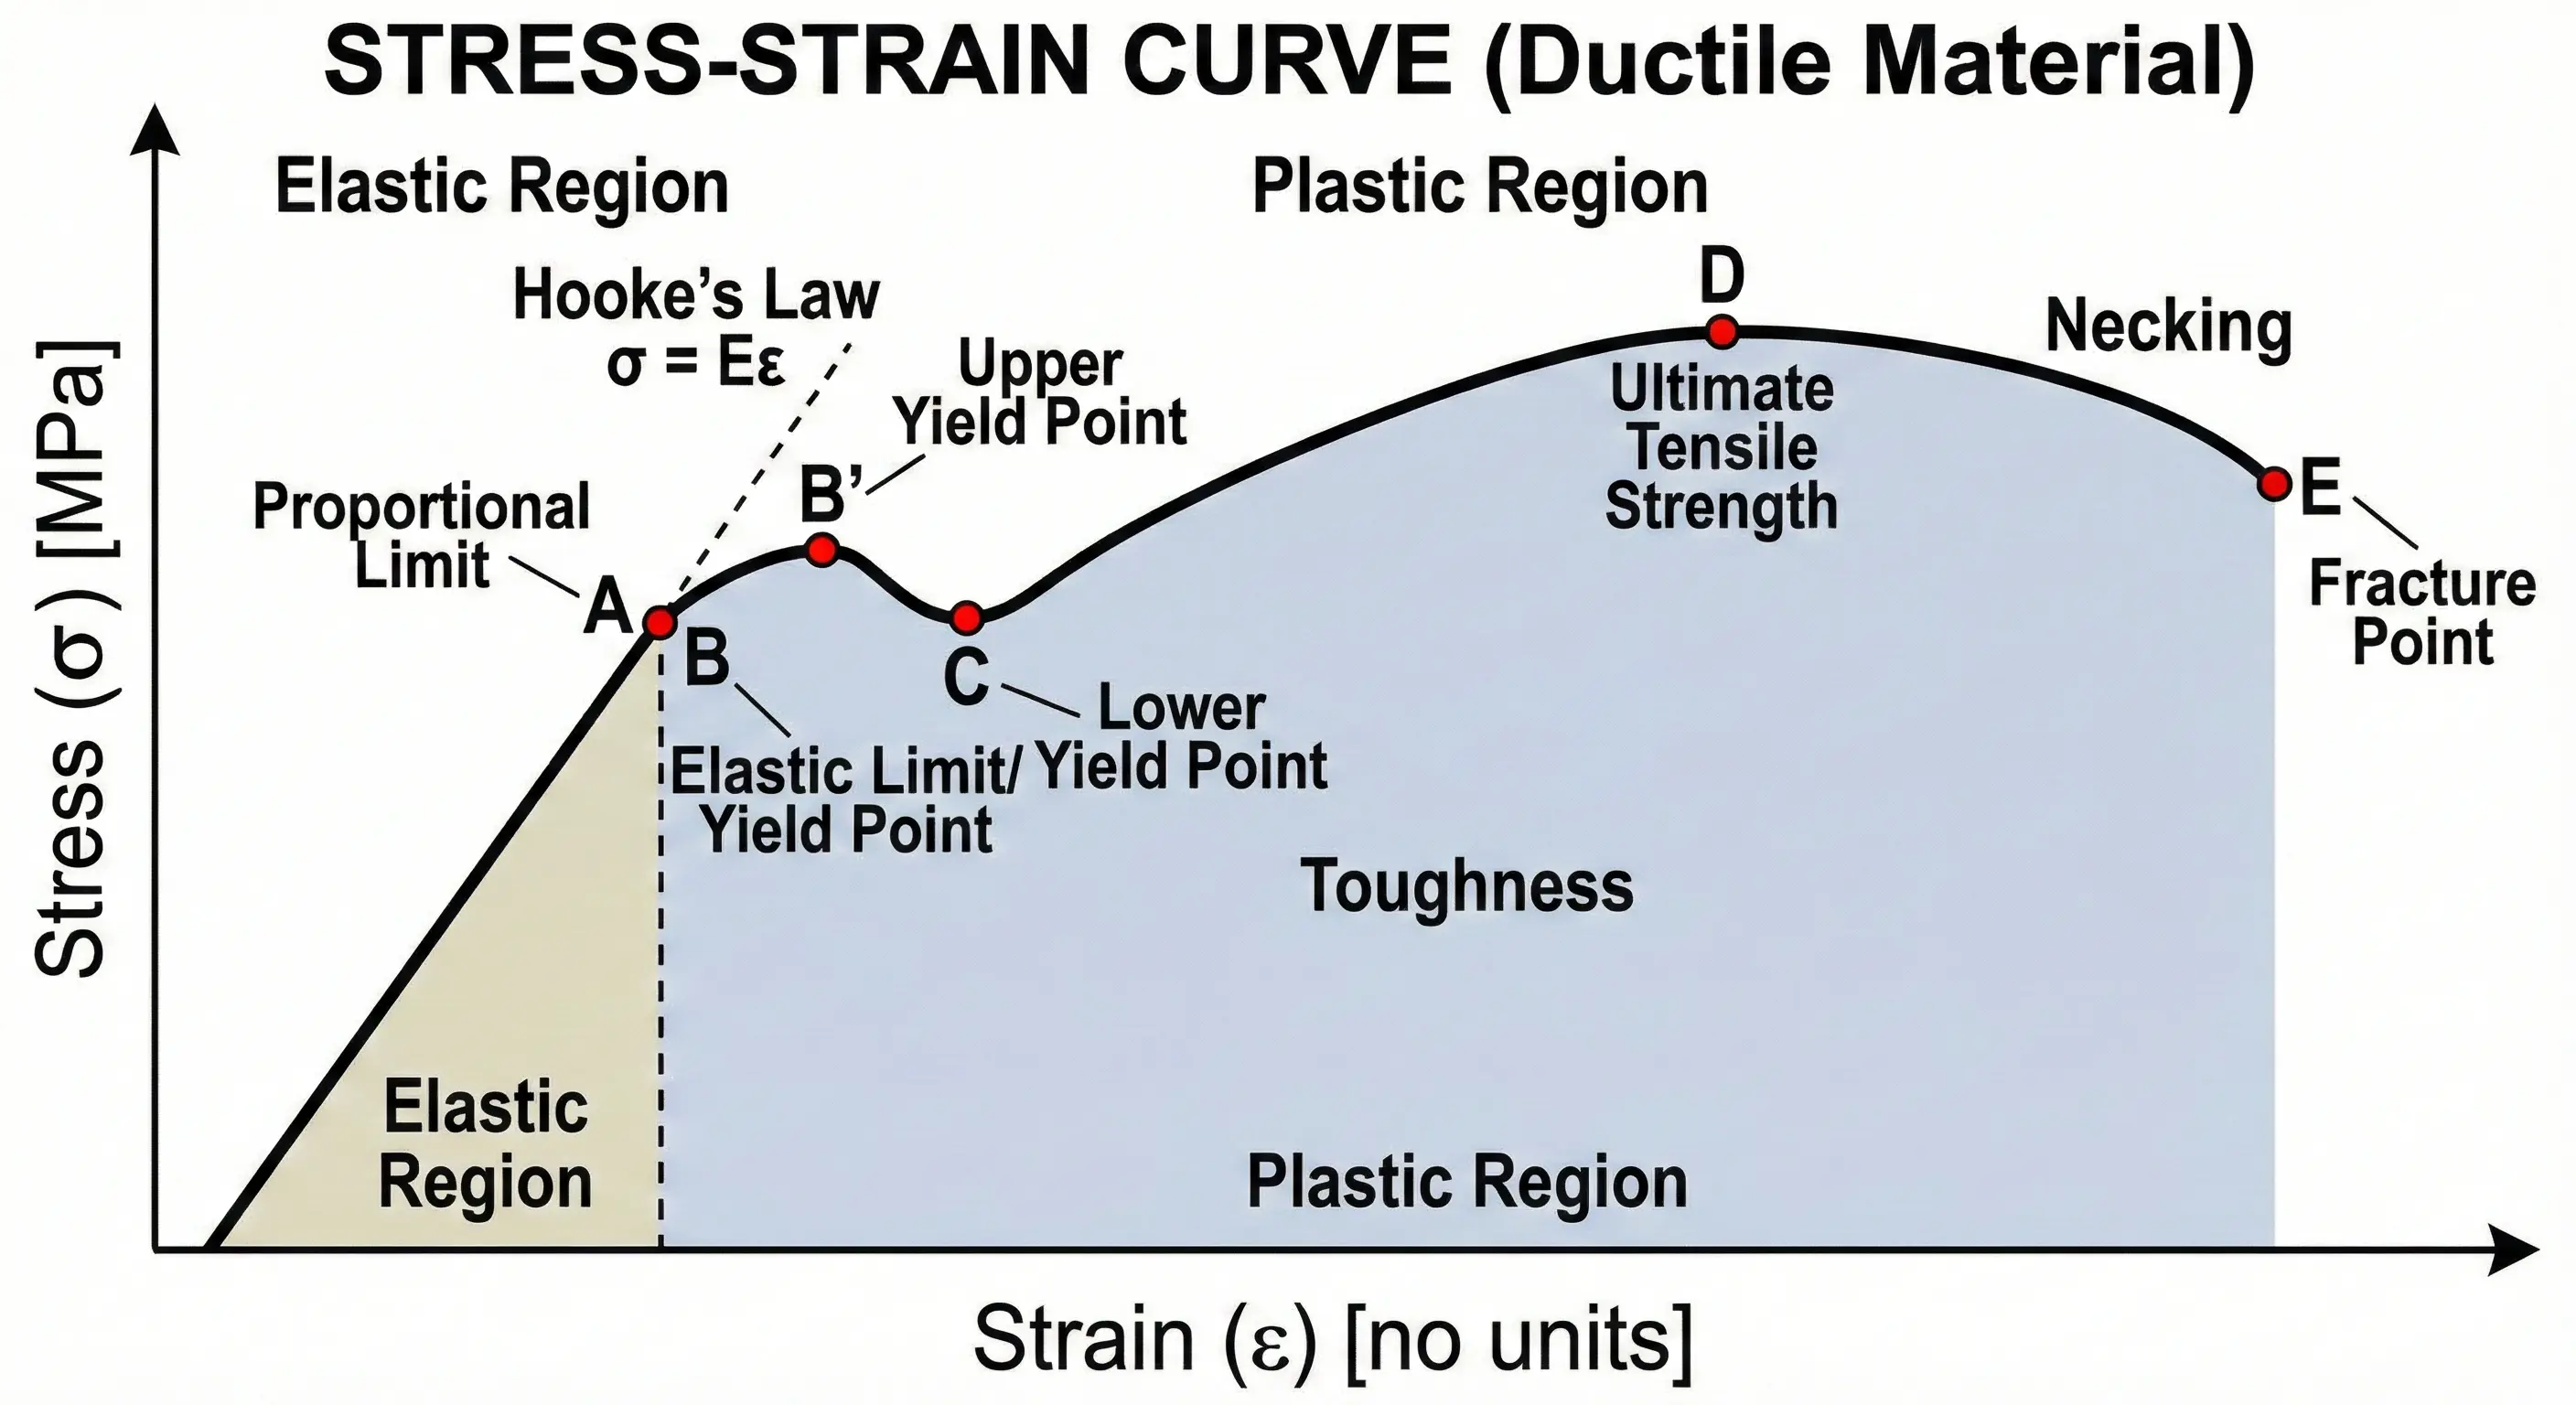
Why it's high-yield: Proportional limit, yield point, breaking point, and elastic vs plastic regions — graph-interpretation favourite.
20
PV Diagrams (Thermodynamic Processes)
Physics
Thermodynamics · Class 11, Ch. 12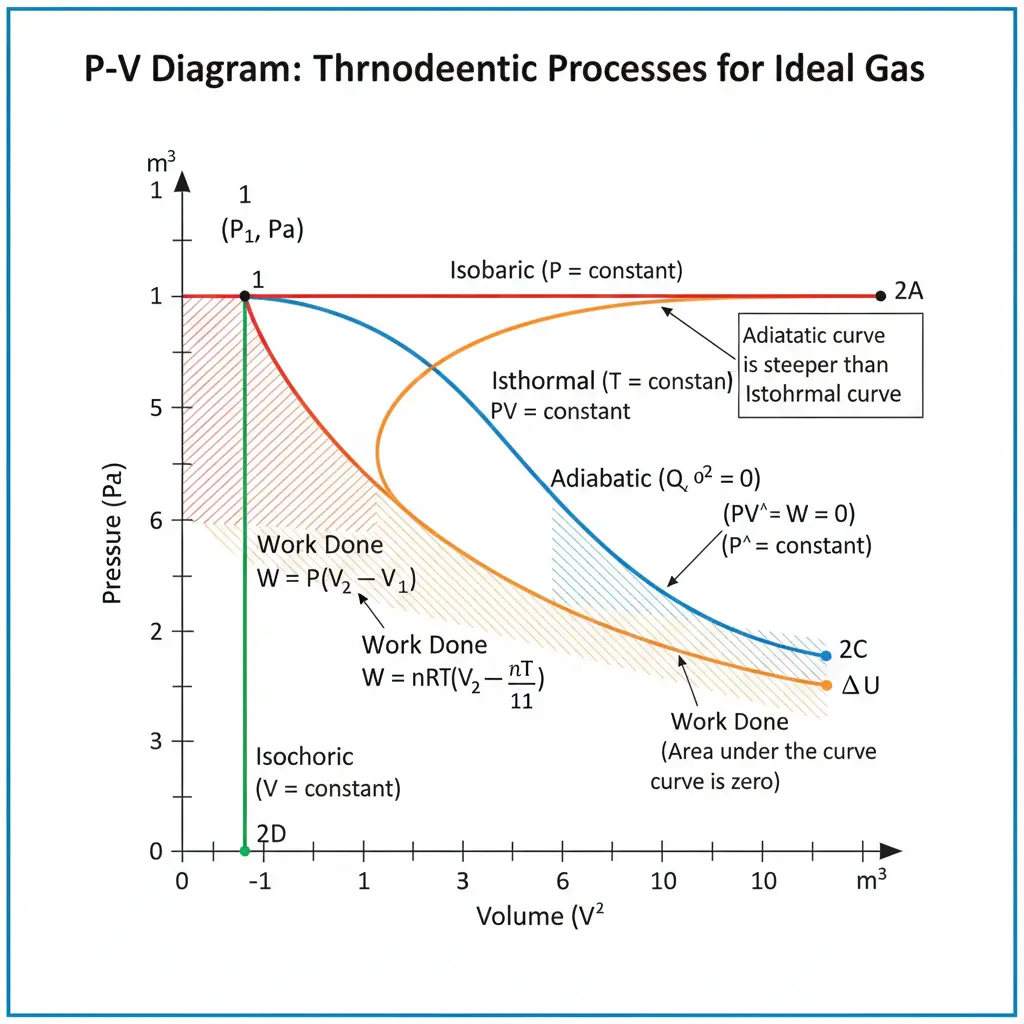
Why it's high-yield: Isothermal, adiabatic, isobaric, isochoric processes on P-V diagram — tested as work-done and efficiency MCQs.
14
Biology Diagrams
4
Chemistry Diagrams
2
Physics Diagrams
Frequently Asked Questions
Which NCERT diagrams are most repeated in NEET?
The Krebs Cycle, DNA Replication Fork, Nephron Structure, Calvin Cycle, and Sarcomere diagrams are the top 5 most frequently tested NCERT diagrams in NEET, appearing in some form almost every year.
How should I study NCERT diagrams for NEET 2027?
Draw each diagram from memory at least 3 times. Focus on labelling accuracy, understand the logic behind each step or structure, and practise related MCQs. Use VocoStudy's audio notes to reinforce the reasoning while you draw.
Are Physics and Chemistry diagrams also asked in NEET?
Yes. Periodic Trends, VSEPR Geometries, Electrochemical Cells (Chemistry), and Stress-Strain Curves, PV Diagrams (Physics) are regularly tested. Biology dominates diagram questions, but Chemistry and Physics contribute 5-8 diagram-based MCQs.
Practise Diagram-Based MCQs Now
Knowing the diagram is step one. Scoring from it requires practising the exact MCQ patterns NEET uses. Jump into chapter-wise quizzes on VocoStudy — each quiz pulls questions that test your labelling accuracy and conceptual depth.
📚 Deepen Your Understanding
Note from the Faculty
"In my two decades of teaching in Kota and Mumbai, I've seen that students who use multi-sensory tools like VocoStudy diagrams and AudioHub notes consistently score 15-20% higher than those using traditional rote methods. Start syncing your senses today."
P V SatishSenior NEET Faculty (20+ Years Exp)